Tag: Sensor

Predicting Sea Surface Salinity from Space

The simplest definition of salinity is how salty the ocean is. Easy enough, right? Why is this basic property of the ocean so important to oceanographers? Well, along with the temperature of the water, the salinity determines how dense it is. The density of the water factors into how it circulates and mixes…or doesn’t mix. Mixing distributes nutrients allowing phytoplankton (and the rest of the food web) to thrive. Globally, salinity affects ocean circulation and can help us understand the planet’s water cycle. Global ocean circulation distributes heat around the planet which affects the climate. Climate change is important to oceanographers; therefore, salinity is important to oceanographers.

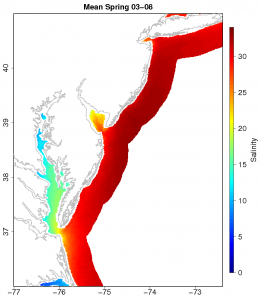
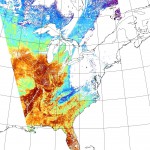
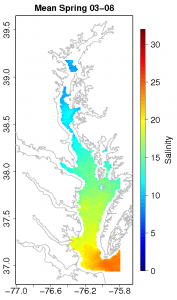
Spring Salinity Climatology for the Chesapeake

Spring Salinity Climatology for the Chesapeake

Salinity doesn’t vary that much in the open ocean, but it has a wide range in the coastal ocean. The coast is where fresh water from rivers and salt water in the ocean mix. Measurements of salinity along the coast help us understand the complex mixing between fresh and salty water and how this affects the local biology, physics, and chemistry of the seawater. However, the scope of our measurements is very small. Salinity data is collected by instruments on ships, moorings, and more recently underwater vehicles such as gliders. While these measurements are trusted to be very accurate, their spatial and temporal resolution leaves much to be desired when compared to say daily sea surface temperature estimated from a satellite in space.

So, why can’t we just measure salinity from a satellite?Well, it’s not as simple, but it is possible. NASA’s Aquarius mission http://aquarius.nasa.gov/ which was launched this past August is taking advantage of a set of three advanced radiometers that are sensitive to salinity (1.413 GHz; L-band) and a scatterometer that corrects for the ocean’s surface roughness. With this they plan on measuring global salinity with a relative accuracy of 0.2 psu and a resolution of 150 km. This will provide a tremendous amount of insight on global ocean circulation, the water cycle, and climate change. This is great new for understanding global salinity changes. What about coastal salinity? What if I wanted to know the salinity in the Chesapeake Bay? That’s much smaller than 150 km.

That’s where my project comes in. It involves NASA’s MODIS-Aqua satellite (conveniently already in orbit: http://modis.gsfc.nasa.gov/), ocean color, and a basic understanding of the hydrography of the coastal Mid-Atlantic Ocean. Here’s how it works: we already know a few things about the color of the ocean, that is, the sunlight reflecting back from the ocean measured by the MODIS-Aqua satellite. We know enough that we can estimate the concentration of the photosynthetic pigment chlorophyll-a. So not only can we see temperature from space, but we can estimate chlorophyll-a concentrations too! Anyway, there are other things in the water that absorb light besides phytoplankton and alter the colors we measure from a satellite.

Spring Salinity Climatology for the Mid-Atlantic

Spring Salinity Climatology for the Mid-Atlantic

We group these other things into a category called colored dissolved organic material or CDOM. CDOM is non-living detritus in the water that either washes off from land or is generated biologically. It absorbs light in the ultraviolet and blue wavelengths, so it’s detectable from satellites. In coastal areas especially, its main source of production is runoff from land. So, CDOM originates from land and we can see a signal of it from satellites that measure color. What’s that have to do with salinity?

You may have already guessed it, but water from land is fresh. So, water in the coastal ocean that is high in CDOM should be fresher than surrounding low CDOM water. Now we have a basic understanding of the hydrography of the coastal Mid-Atlantic Ocean, how it relates to ocean color, and why we need the MODIS-Aqua satellite to measure it. So, I compiled a lot of salinity data from ships (over 2 million data points) in the Mid-Atlantic coastal region (Chesapeake, Delaware, and Hudson estuaries) and matched it with satellite data from the MODIS-Aqua satellite in space and time. Now I have a dataset that contains ocean color and salinity. Using a non-linear fitting technique, I produced an algorithm that can predict what the salinity of the water should be given a certain spectral reflectance. I made a few of these algorithms in the Mid-Atlantic, one specifically for the Chesapeake Bay. It has an error of ±1.72 psu and a resolution of 1 km. This isn’t too bad considering the range in salinity in the Chesapeake is from 0-35 psu, but of course there’s always room for improvement. Even so, this is an important first step for coastal remote sensing of salinity. An algorithm like this can be used to estimate salinity data on the same time and space scale as sea surface temperature. That’s pretty useful. The folks over at the NOAA coastwatch east coast node thought so too. They took my model for the Chesapeake Bay and are now producing experimental near-real time salinity images for the area. The images can be found here: http://coastwatch.chesapeakebay.noaa.gov/cb_salinity.html. They will test the algorithm to see if it is something they want to use

Climatologies of salinity for all of my models can be downloaded here: http://modata.ceoe.udel.edu/dev/egeiger/salinity_climatologies/.

I view this project as an overall support of the NASA Aquarius mission by providing high resolution coastal salinity estimates that are rooted in in situ observations. I hope this information proves to be useful for coastal ocean modeling and understanding the complex process that effect the important resource that is our coasts.

Sub-Bottom Profiling using an AUV

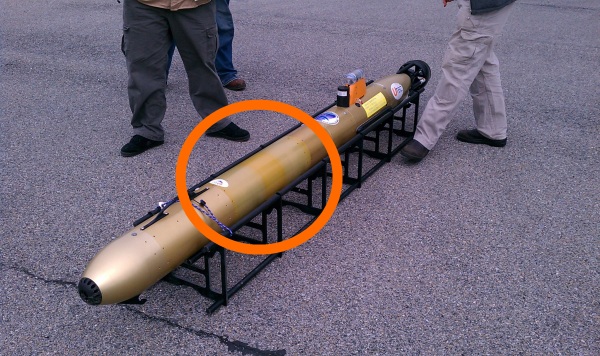
I was minding my own business, walking between Smith Lab and Cannon Lab buildings when what to my wandering eyes should appear but a reeeallly long stretched out Gavia Scientific AUV. My geek radar started going off and I just HAD to investigate exactly what was inside these newly milled sections of hull.

Gavia Scientific AUV with a recent addition

Gavia Scientific AUV with a recent addition

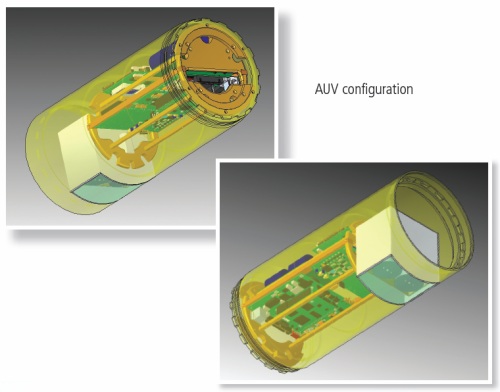
I invited myself into the lab and started asking some questions. It turns out that these new sections contain a prototype Teledyne Benthos Chirp III sub-bottom profiler that was specially designed to integrate with an AUV. Dr. Art Trembanis’ CShel lab and Val Schmidt from the University of New Hampshire’s Center for Coastal and Ocean Mapping were working with UTEC Survey Inc. to successfully integrate and test this new addition to the AUV’s sensor lineup. I cornered Nick Jarvies from UTEC and he gave me the run-down on the new addition (thanks Nick!):

httpv://www.youtube.com/watch?v=fQkWAhaFcsk

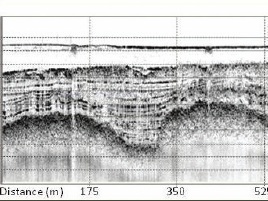
Sample SBPWhat is a “sub-bottom profiler” you ask? Per the Wikipedia entry, it is a “powerful low frequency echo-sounder…developed for providing profiles of the upper layers” of the ocean floor. In the case of the Chirp III, probably in the range of 10-20kHz. Per Dr. Trembanis “Data is stored in an onboard Compact Flash card in an industry standard SEG-Y format.  The advantage of a chirp signal over a single frequency output is that through chirp demodulation of the returning signal one can get a better compromise between penetration and resolution.  The lower the frequency the greater the penetration but the less the resolution (and vice versa for high frequency) so a chirp signal which modulates from a low to high frequency provides penetration and resolution.  All of this depends to a great degree on the kind of bottom material one is trying to penetrate.”

Internal view of the Benthos Chirp III AUV SBP

Internal view of the Benthos Chirp III AUV SBP

The advantages of an AUV-based sub-bottom profiler (also per Art Trembanis) are:

  • We remove lots of water column data that would normally be unwanted and has to be removed/ignored from the record.
  • Because we can precisely follow the terrain near the bed or hold a constant depth well below the surface we can remove/diminish effects of waves that cause a ship to bob up and down.
  • We are able to do higher resolution characterization of the subsurface in greater water depths since otherwise from a surface ship you would have to use a lower frequency system to penetrate through the water column.
  • Because of the precise navigation of the AUV we can get very tight line spacing and precision following of features (i.e. pipeline routes) which allows us to provide better data more efficiently.

Thanks to everybody for taking time to talk on camera and for answering my questions!

OSU Ships Underway Data System

One of the highlights of going to the RVTEC meeting is getting to hear about some of the cool projects that are underway at the various institutions. One talk that caught my attention was the SUDS system, an NSF sponsored project that was given by the techs at Oregon State University.

I talked David O’Gorman and Toby Martin into doing a quick rundown on their SUDS system on camera during one of the breaks. SUDS is an acronym for the Ships Underway Data System, which consists of software and two data acquisition boards that they designed in-house – one analog and one digital. Each board can be programmed with metadata about the sensors that are attached to them. When the boards are plugged into the ships network they broadcasting XML data packets which include both data and metadata about the data via UDP for a back-end data acquisition to capture and store. For redundancy, there can be multiple acquisition systems on the network as well I’m told.

The data acquisition cards can be either powered directly or via POE (Power Over Ethernet). They can also supply power to the sensor if needed. The digital cards can accept RS232 and RS485. The analog has 4 differential input channels which can do 0-5v on two of the channels and 0-15v on the other two and range from 600Hz to 20kHz input signals.

Their website has links to a PDF of the presentationthey did at the 2010 UNOLS RVTEC meeting as well as various examples of data packets that the system broadcasts. Definitely something that could be quite useful to handle the ever-changing data acquisition needs on today’s research vessels. I look forward to learning more about the SUDS system in the days to come.

UNOLS RVTEC 2010

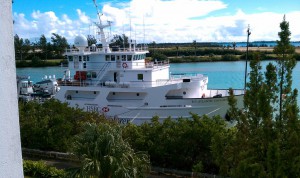
RV HSBC Atlantic Explorer

RV HSBC Atlantic Explorer

Just got back from the 2010 UNOLS RVTEC meeting, which was held at the Bermuda Institute of Ocean Science (BIOS) – home of the RV HSBC Atlantic Explorer.

(Acronym Police: UNOLS = University-National Oceanographic Laboratory System and RVTEC = Research Vessel Technical Enhancement Committee).

For those unfamiliar with RVTEC, it is a committee organized around 1992 to “provide a forum for discussion among the technical support groups of the National Oceanographic Fleet” in order to “promote the scientific productivity of research programs that make use of research vessels and oceanographic facilities and to foster activities that enhance technical support for sea-going scientific programs” as listed in Annex V of the UNOLS charter. Membership is extended to UNOLS member institutions but “Participation shall be open to technical and scientific personnel at UNOLS and non-UNOLS organizations”.

The meeting agenda was pretty intense and we were pretty much straight out from Monday through Friday afternoon. There were a lot of scary smart people in the room doing some pretty amazing things in support of science operations at their respective institutions. I tried to compile a list of Tech Links on the ResearchVessels.org site to make it easier to find some of the various resources that were discussed at the meeting. I did the same thing at last years RVTEC meeting in Seattle but some additions and corrections were needed based on feedback from the members. I’m hoping that I’ll be able to obtain funding to attend next years meeting and perhaps the upcoming Inmartech meeting (look for a post on Inmartech soon).

I shot some video, made some fantastic contacts and had some interesting discussions at this years RVTEC meeting. If all goes smoothly, I’ll have a couple of new blog entries online this week to help share some of the wealth of knowledge.

Polar Orbiting Satellite Receiving Station

The video above is a quick screencast NASA JPL’s Eyes on the Earth application, which shows the tracks of various satellites orbiting the globe. It’s a really cool application that gives a top-notch overview of some of the satellites currently in orbit and their trajectories around the Earth. Take some time and poke around, you’ll be glad you did.

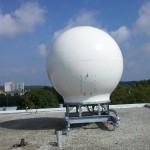
Polar Satellite RadomeThe reason I included it is that I promised to cover the polar orbiting satellite receiving station in a previous blog post about the new Satellite Receiving Station in Delaware. In the previous post I discussed the geostationary satellite receiving station. In this post, I hope to shed some light on the polar orbiting receiving setup.

What’s Inside the Radome

MODIS Satellite PassThe equipment for the polar orbiting satellite receiving station is a bit more involved than the pretty much non-moving geostationary setup. As the name implies, the polar orbiting satellites do just that, they orbit the Earth north and south, going from pole to pole. Their path is relatively simple, they just go around the earth in circles, but as they’re doing so, the Earth is rotating beneath them. The satellites point their cameras towards the earth and essentially capture a swath of data during each rotation. Since the Earth is rotating beneath them, the swath appears as a diagonal path if you look at the overlay.

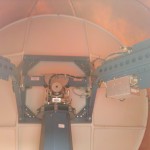
Inside the RadomeIn order to capture data from a moving target, the dish has to be able to rotate and move in three axis in order to follow the satellite of interest. In order to protect the receiving equipment from the weather, it is typically installed in a circular fiberglass enclosure called a “radome”. To keep the design relatively simple, there is only one mounting configuration and radome setup created, and that’s designed to mount onboard a ship. It is then relatively simple to attach a mounting bracket to the top of a building and bolt the radome assemgly to it.

The video at the top of the page shows that there are several satellites in orbit, so the Terascan software has to pull down satellite ephemeral data from Celestrak each day, take into account the location of the tracking station, and generate a calculated schedule of which satellites will be visible to the satellite dish throughout the day. As there may be more than one satellite in view during any given time period, the satellite operator assigns a priority weighting to each satellite. The Terascan software then uses that weighting to decide which satellite it will aim the dish at and start capturing data.

Receiving Station Workstations

Acquisition and Processing SystemsInside the building is a rack of computers and receivers whose purpose in life is to control the dish on the roof of the building and to receive and process the data it relays down from the satellite. The receiving station at UD has both X and L-Band receivers which receive the data stream and pass it to a SeaSpace Satellite Acquisition Processor. The processor then sends the data packets to a Rapid Modis Processing System (RaMPS) which combines the granularized HDF data files from the satellites into a TeraScan Data File (TDF) file. Once in this format, various programs and algorithms can be run against the TDF file and channels of interest can be combined using NASA/NOAA and other user supplied algorithms to create the output product of interest. As the files can get rather large and there can be several of them coming in throughout the day, they are then moved over to a Networked Attached Storage (NAS) server and stored until they are needed.

Satellites Licensed

The UD receiving station is licensed and configured to receive data from the following satellites:

  • Aqua
  • Terra
  • NOAA 15
  • NOAA 17
  • NOAA 18
  • NOAA 19
  • MetOp-A (Europe)
  • FY-1D (China)

Hopefully this sheds a little more light on the polar orbiting receiving station and its capabilities. Let me know if there are any additions or corrections to the information I’ve posted.

CTD and Dissolved Oxygen Measurement via Winkler Titration

Last fall I was on the RV Hugh R Sharp for a short research cruise out in the Delaware Bay. We were sharing the Sharp with chief scientist Dr. George Luther, who was doing a mooring deployment that contained a dissolved oxygen sensor (among several other sensors). As part of the calibration check to make sure the readings were correct while we were on station, Dr. Luther did several CTD casts to take some water samples at various depths. I snagged the trusty video camera and got him to explain what he was doing and why.

To verify the accuracy of modern electronic oxygen sensors, oceanographers still verify the dissolved oxygen concentration using what’s called the Winkler test for dissolved oxygen. Dr. Luther showed the process of fixing oxygen into a MnOOH solid, which is then measured by the Winkler titration. This allows scientists to compare the oxygen readings they’re getting now with historical records of oxygen levels going back to the late 1800’s (an important thing to do when you’re trying to determine long-term trends by comparing historical records against more recent observations). It also allows them to verify the readings that they’re getting from modern electronic oxygen sensors.

I’ll sneak down to Dr. Luther’s lab soon and video the second part of the process, where they add the additional chemicals to the mix and determine the actual concentration of dissolved oxygen. Thanks again to Dr. Luther for taking time to explain the process.

Scanfish Undulating Towed Vehicle

Lucky me, I happened to be in the right place at the right time.  I was over at the CEOE Marine Operations Building and I ran into Brian Kidd, a marine technician aboard the RV Hugh R. Sharp. Brian is the resident expert on multibeam echosounder systems and he agreed to talk on camera about some of the data acquisition systems that he’s involved with. While we were talking I noticed that the Scanfish was opened up and getting prepped for an upcoming science mission, so Brian volunteered to talk about the Scanfish as well.  The segment on the multibeam is a tad longer as we had to do some travelling around the ship and ashore to cover the various components as it was being serviced. The multibeam video will be posted shortly has been posted and is available here

Background:

The Scanfish was originally a product of GMI of Denmark. GMI was purchased by EIVA, who integrated the Scanfish into their suite of hardware and software solutions in support of marine science and surveying. EIVA hosts a PDF showing specs for the Scanfish MK II on their site. The MK II looks like it is the equivalent of the Scanfish we discussed with Brian. EIVA also provides smaller Scanfish units including the Scanfish Mini and the Scanfish MK I.

The Scanfish is “flown” and monitored via a conductive cable that feeds data and parameters back to EIVA’s “Flight Software” – which the technician uses to control the Scanfish, the winch and to display and log the data being collected.

In addition to housing a CTD (which stands for Conductivity + Temperature + Depth) sensor, the Scanfish also supports the following optional sensors:

  • Fluorometer
  • Turbidity sensor
  • Transmissiometer
  • Oxygen sensor
  • Optical Plankton Counter
  • ADCP (Acoustic Doppler Current Profiler)
  • Video Camera
  • Other customer supplied sensors

© 2025 Ocean Bytes Blog

Theme by Anders NorenUp ↑