Tag: NASA

Utilizing New Tagging Technology to Characterize Sand Tiger Shark Habitat

Sand tiger sharks are large bottom dwelling sharks found in the coastal waters of the Eastern North Atlantic, and are known to frequent the Delaware Bay in the summer months. Sand tiger shark populations are currently in danger of over exploitation because they are slow growing and have extremely low birth rates. While we know that the sharks are found within the Delaware Bay during summer months, little is known about their movements during the rest of the year, or what oceanographic conditions limit their spatial extent. There is evidence that these sharks make large coastal migratory movements along the Eastern Seaboard. This makes habitat characterization difficult because the sharks travel throughout such a large area. It is important for managers to know the areas of intensive use by the sharks, and the species assemblages within those areas, in order to protect these apex predators.

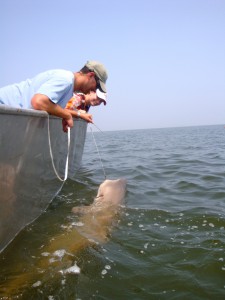
Dr. Matthew Oliver and Danielle Haulsee with a sand tiger shark caught in the Delaware Bay.

Our project, a collaboration among Delaware State University’s Dewayne Fox and the University of Delaware’s Matthew Oliver and Danielle Haulsee, will document and characterize the movements of sand tiger sharks, their habitat preferences, and the community assemblages they encounter using new and innovative electronic tagging technology. Sand tiger shark movements will be recorded using passive telemetry in addition to pop-off satellite archival tags. We will also deploy a new type of tagging technology, which acts as a mobile receiver, and will record any encounters with other sharks, fish or other marine animals that have been tagged with acoustic tags. We will then use satellite and remotely sensed data resources from the Mid-Atlantic Regional Association for Coastal Ocean Observing Systems (MARACOOS) to characterize and model the habitats and oceanographic conditions used by sand tiger sharks. This study will give managers a better understanding of the spatiotemporal patterns in sand tiger shark movements along the East Coast, as well as inform management decisions regarding sand tiger shark habitat utilization.

Predicting Sea Surface Salinity from Space

The simplest definition of salinity is how salty the ocean is. Easy enough, right? Why is this basic property of the ocean so important to oceanographers? Well, along with the temperature of the water, the salinity determines how dense it is. The density of the water factors into how it circulates and mixes…or doesn’t mix. Mixing distributes nutrients allowing phytoplankton (and the rest of the food web) to thrive. Globally, salinity affects ocean circulation and can help us understand the planet’s water cycle. Global ocean circulation distributes heat around the planet which affects the climate. Climate change is important to oceanographers; therefore, salinity is important to oceanographers.
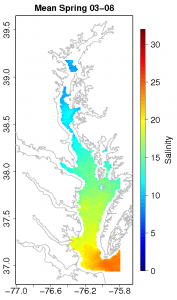
Spring Salinity Climatology for the Chesapeake

Spring Salinity Climatology for the Chesapeake

Salinity doesn’t vary that much in the open ocean, but it has a wide range in the coastal ocean. The coast is where fresh water from rivers and salt water in the ocean mix. Measurements of salinity along the coast help us understand the complex mixing between fresh and salty water and how this affects the local biology, physics, and chemistry of the seawater. However, the scope of our measurements is very small. Salinity data is collected by instruments on ships, moorings, and more recently underwater vehicles such as gliders. While these measurements are trusted to be very accurate, their spatial and temporal resolution leaves much to be desired when compared to say daily sea surface temperature estimated from a satellite in space.

So, why can’t we just measure salinity from a satellite?Well, it’s not as simple, but it is possible. NASA’s Aquarius mission http://aquarius.nasa.gov/ which was launched this past August is taking advantage of a set of three advanced radiometers that are sensitive to salinity (1.413 GHz; L-band) and a scatterometer that corrects for the ocean’s surface roughness. With this they plan on measuring global salinity with a relative accuracy of 0.2 psu and a resolution of 150 km. This will provide a tremendous amount of insight on global ocean circulation, the water cycle, and climate change. This is great new for understanding global salinity changes. What about coastal salinity? What if I wanted to know the salinity in the Chesapeake Bay? That’s much smaller than 150 km.

That’s where my project comes in. It involves NASA’s MODIS-Aqua satellite (conveniently already in orbit: http://modis.gsfc.nasa.gov/), ocean color, and a basic understanding of the hydrography of the coastal Mid-Atlantic Ocean. Here’s how it works: we already know a few things about the color of the ocean, that is, the sunlight reflecting back from the ocean measured by the MODIS-Aqua satellite. We know enough that we can estimate the concentration of the photosynthetic pigment chlorophyll-a. So not only can we see temperature from space, but we can estimate chlorophyll-a concentrations too! Anyway, there are other things in the water that absorb light besides phytoplankton and alter the colors we measure from a satellite.
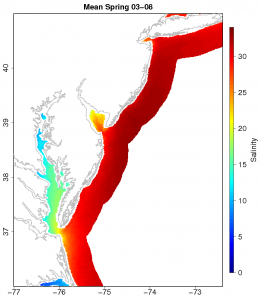
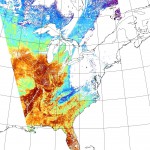
Spring Salinity Climatology for the Mid-Atlantic

Spring Salinity Climatology for the Mid-Atlantic

We group these other things into a category called colored dissolved organic material or CDOM. CDOM is non-living detritus in the water that either washes off from land or is generated biologically. It absorbs light in the ultraviolet and blue wavelengths, so it’s detectable from satellites. In coastal areas especially, its main source of production is runoff from land. So, CDOM originates from land and we can see a signal of it from satellites that measure color. What’s that have to do with salinity?

You may have already guessed it, but water from land is fresh. So, water in the coastal ocean that is high in CDOM should be fresher than surrounding low CDOM water. Now we have a basic understanding of the hydrography of the coastal Mid-Atlantic Ocean, how it relates to ocean color, and why we need the MODIS-Aqua satellite to measure it. So, I compiled a lot of salinity data from ships (over 2 million data points) in the Mid-Atlantic coastal region (Chesapeake, Delaware, and Hudson estuaries) and matched it with satellite data from the MODIS-Aqua satellite in space and time. Now I have a dataset that contains ocean color and salinity. Using a non-linear fitting technique, I produced an algorithm that can predict what the salinity of the water should be given a certain spectral reflectance. I made a few of these algorithms in the Mid-Atlantic, one specifically for the Chesapeake Bay. It has an error of ±1.72 psu and a resolution of 1 km. This isn’t too bad considering the range in salinity in the Chesapeake is from 0-35 psu, but of course there’s always room for improvement. Even so, this is an important first step for coastal remote sensing of salinity. An algorithm like this can be used to estimate salinity data on the same time and space scale as sea surface temperature. That’s pretty useful. The folks over at the NOAA coastwatch east coast node thought so too. They took my model for the Chesapeake Bay and are now producing experimental near-real time salinity images for the area. The images can be found here: http://coastwatch.chesapeakebay.noaa.gov/cb_salinity.html. They will test the algorithm to see if it is something they want to use

Climatologies of salinity for all of my models can be downloaded here: http://modata.ceoe.udel.edu/dev/egeiger/salinity_climatologies/.

I view this project as an overall support of the NASA Aquarius mission by providing high resolution coastal salinity estimates that are rooted in in situ observations. I hope this information proves to be useful for coastal ocean modeling and understanding the complex process that effect the important resource that is our coasts.

Hurricane Katia Footprints

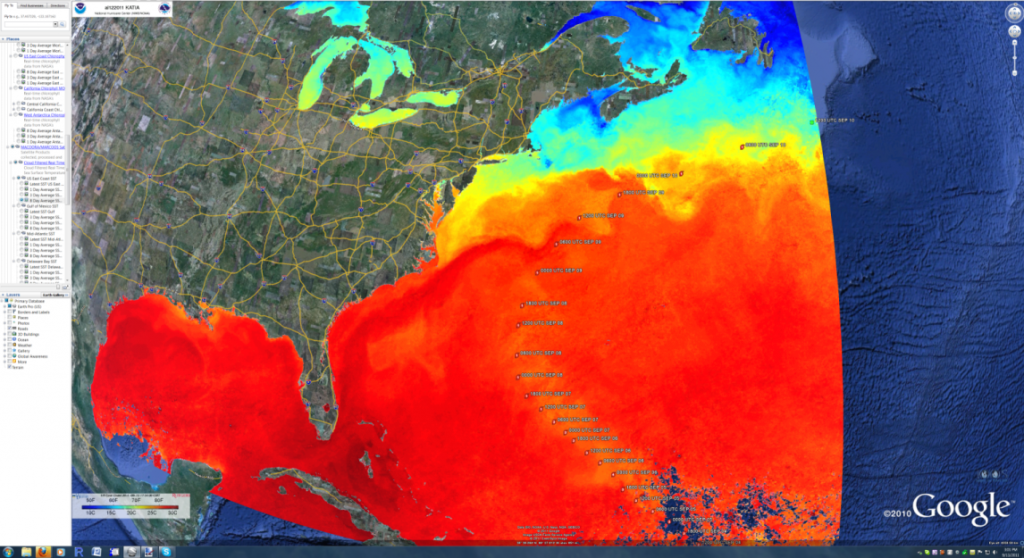
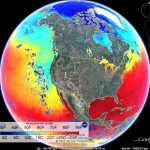
The ORB Lab was having a meeting in the GVis Lab this week and, as usual, the East Coast US 8-Day Averaged Sea Surface Temperature overlay was up on the screens. Dr. Oliver pointed to the screen and noted that there was a path cutting across the Gulf Stream that was cooler than usual and that it was probably due to upwelling and mixing from hurricane Katia. Sure enough, we loaded up a layer showing Katia’s track and they lined up.

Katia SST Trail

Katia SST Trail

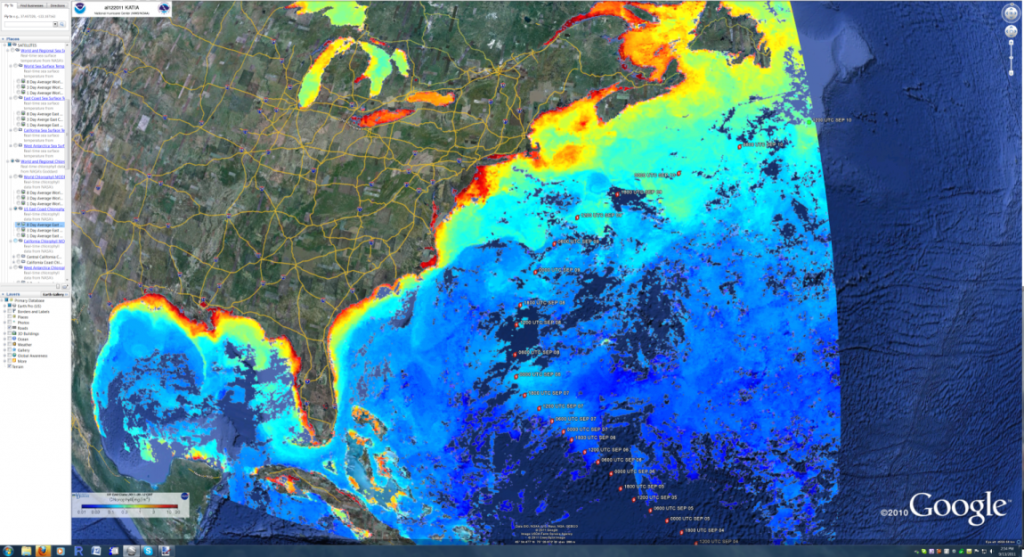
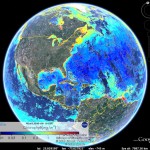
We then checked to see if there was anything noticeable on the East Coast US 8-Day Average Chlorophyll layer and you can see what appears to be a slight bloom in chlorophyll along the track as well (slightly lighter blue).

Katia Cholorophyll Trail

Katia Cholorophyll Trail

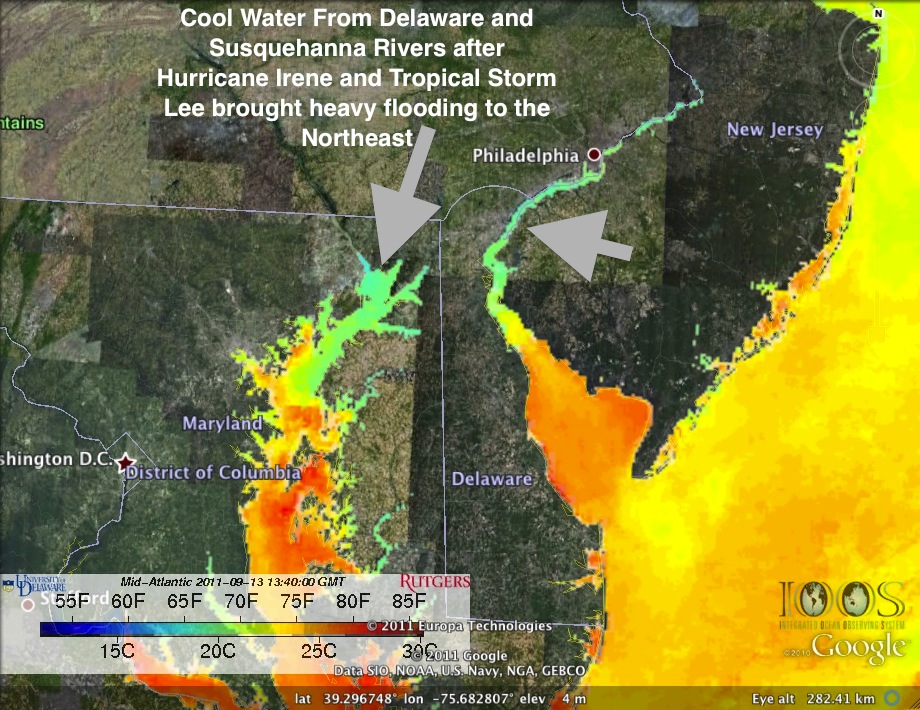
Another neat view is the markedly cooler water that you flowing into the bays from the increased river discharge that resulted from the large amounts of rain dropped by hurricane Katia and tropical storm Lee as they passed through.

Cold river water 20110913

Cold river water 20110913

These layers and several others are processed and uploaded daily and made available via the Orb Lab website in the Public Access section. They are exposed via Google Maps interfaces as well as Google Earth embedded views and linkable KMZ file formats. Neat stuff!
NASATweetup Mission Accomplished

Welcome Home Flat Samantha!

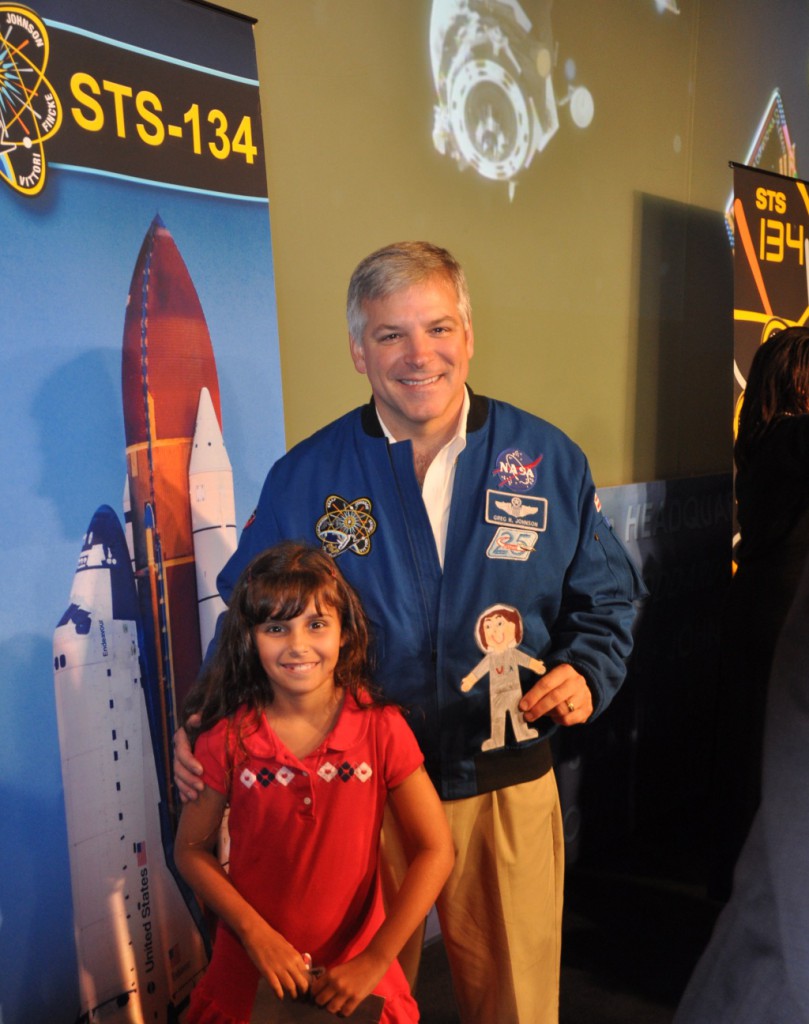
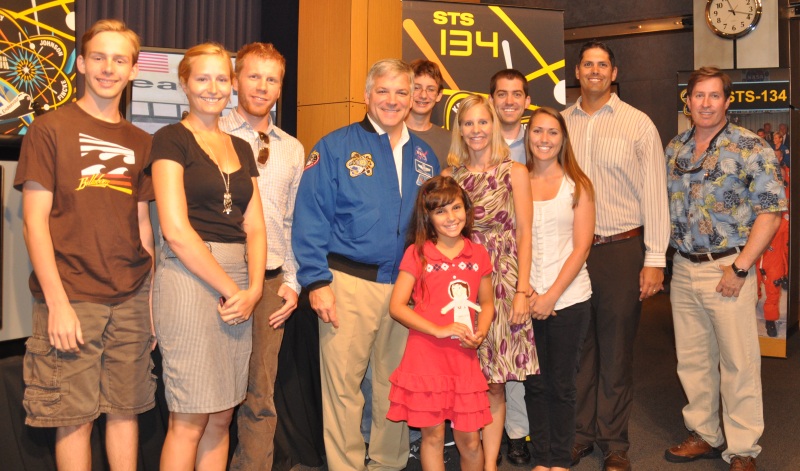
Samanthas and Astronaut Greg Johnson

Samanthas and Astronaut Greg Johnson

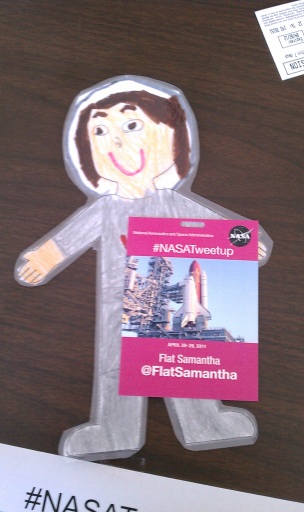
Everything has finally come full circle and Flat Samantha is once again re-united with her creator Samantha. Calling @FlatSamantha‘s trip a “circle” might be a bit of a misnomer however as she has had a wild adventure over the last couple of months. Her journey started in April when young Samantha found out that I was selected to attend the #NASATweetup for the final launch of the space shuttle Endeavour (#STS134). Samantha (and all the rest of the students in the lab) were disappointed that they couldn’t come with me to watch this historic launch, and Samantha took matters (and scissors and markers) into her own two hands and created a flat adventurer that she named Flat Samantha. She asked me if Flat Samantha could ride with me to the Endeavour launch and go up in the shuttle to the International Space Station. I would have loved to say “yes” but I had to inform Samantha that time was too short and that I could only take her down to watch the shuttle launch, but that I would take lots of pictures of her during this adventure and let her share them via a Twitter account that was set up for her (after all, she was going down to a NASATweetup – how’s a girl to tweet if she doesn’t have an account ;?).
I emailed Stephanie Schierholz that I would like to bring along another #NASATweetup attendee and that she wouldn’t take up any extra space. Without batting an eye Ms. Schierholz said “no problem, I’ll have a #NASATweetup badge waiting for her as well”.

FlatSamantha STS134 NASATWeetup Badge

FlatSamantha STS134 NASATWeetup Badge

The original launch date for the shuttle was adjusted forward as there was a conflict between when the Endeavour would be at the ISS and when the Soyuz 25S capsule would be there with some time sensitive experiments. It just so happened that the new launch date fell during my sons spring break period at school, so we scheduled a family vacation to Orlando prior to the launch and had a blast sharing the road trip down and the theme park adventures with Flat Samantha prior to the new launch date. I took her over to the Kennedy Space Center for the #STS134 #NASATweetup where we enjoyed the many presentations that the fine people at NASA had arranged for us on day #1 and then came back for what ended up being a scrubbed launch on day #2 (see: “STS-134 NASATweetup is only half over“).

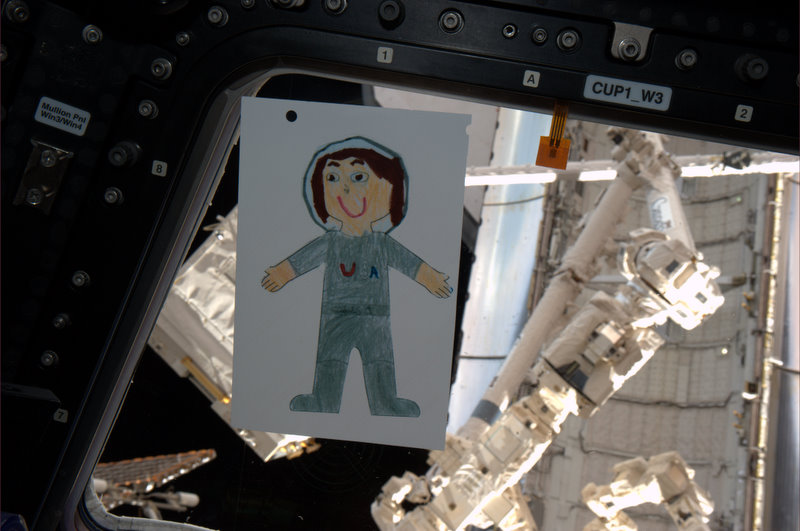
We sat in the tent waiting for the hundreds of thousands of other disappointed spectators that were parked outside the Kennedy Space Center to head home after the launch scrub, knowing that it would be a couple of hours at least before the roads would be passable. As we chatted amongst ourselves, I started talking with Beth Beck and she asked me about the back story on my flat companion. I told her about Samantha and how she would like to have seen Flat Samantha go into space and that I could only promise to get her to the NASATweetup event to watch the launch. Ms. Beck said that since the launch was scrubbed, that there might be a possibility to fulfill Samantha’s wishes and that she would get back to me. Sure enough, a few days later I got an email from her saying that one of the astronauts – Gregory Johnson (aka @Astro_Box) said that he would do what he could to get @FlatSamantha into space. True to his word, we received a picture from space of one @FlatSamantha in the cupola of the International Space Station.

Flat Samantha in the ISS Cupola (photo by Gregory Johnson)

Flat Samantha in the ISS Cupola (photo by Gregory Johnson)

Upon the Endeavour’s return, Flat Samantha was escorted to a couple of other NASA Tweetup events including the #NASATweetup for the Sophia Telescope, the @NASAJPL Tweetup by @Schierholz and even the historic landing of the space shuttle Atlantis #STS135 with @BethBeck. Being flat and portable makes it much easier to get invited to some pretty awesome events it seems.

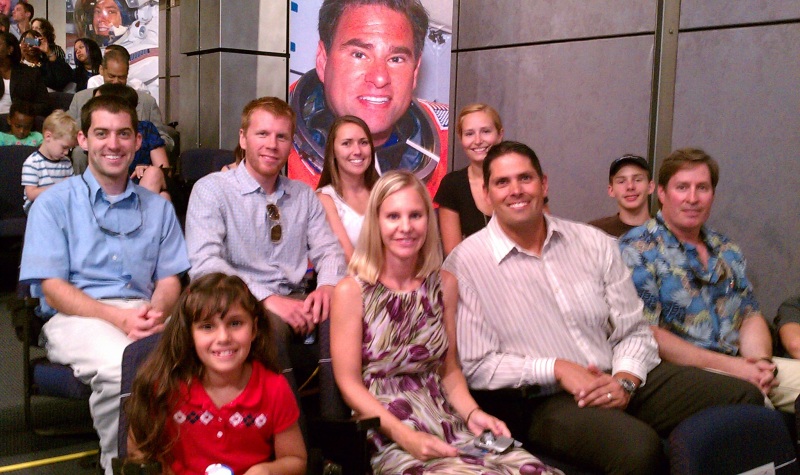
The title of this post is “NASATweetup Mission Accomplished” because the journey home to creator Samantha was accomplished this past week. The journey home was not via a FedEx envelope or the like, however. Flat Samantha was escorted home and hand-delivered by none other than astronaut Gregory Johnson while he was on the east coast giving a mission debriefing to NASA empoyees at NASA HQ in DC. Samantha, her parents and myself were invited to attend the debriefing and to meet with @Astro_Box for some photos following the debriefing by the ever awesome Beth Beck. When the University of Delaware’s ORB Lab students (who were anxiously following @FlatSamantha’s adventure) found out about the trip, they asked if they could come too. I asked Ms. Beck whether that was possible and not only did she say “yes” but she provided the entire group with reserved up-front seating for the debrief!

NASA HQ Debrief

NASA HQ Debrief (photo by Beth Beck)

I want to give a heart-felt thank you to Stephanie Schierholz and Beth Beck for allowing us all to join @FlatSamantha in her whirlwind adventure, both via Twitter and in person. I would also like to thank Gregory Johnson for making not only one little girls wish come true by bringing her flat proxy into space, but for also taking time out of his incredibly busy schedule to bring that excitement to our small group of students and the rest of the world. The employees and representatives of NASA embody the compassion, the “can do” attitude and the educational and outreach expertise that the rest of us should pay close attention to. We are all honored to have been included in these adventures and their memories that we will carry with us for a lifetime. Rocket On NASA!

Group Photo with Greg Johnson and Flat Samantha (photo by Beth Beck)

Group Photo with Greg Johnson and Flat Samantha (photo by Beth Beck)

PS – All of the Flat Samantha #STS134 #NASATweetup adventure photos have been uploaded to the Flat Samantha Ocean Bytes media gallery – enjoy!

Endeavour (STS-134) Launch Photos

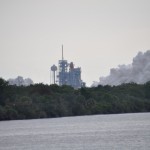
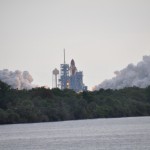
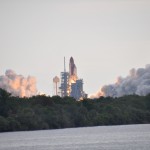
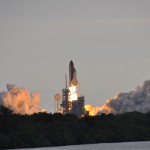
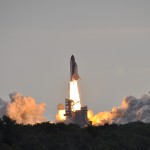
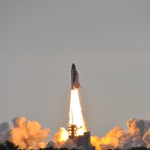
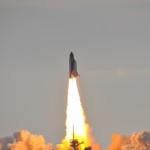
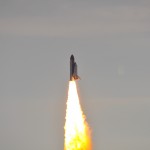
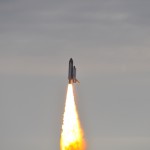
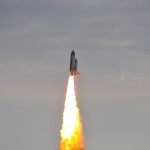
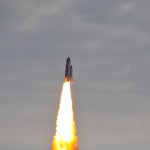
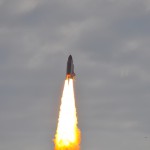
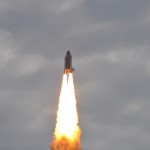
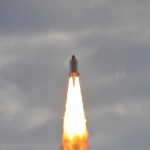
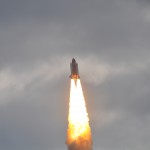
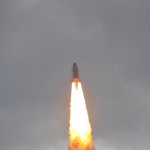
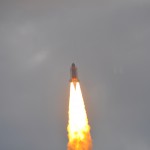
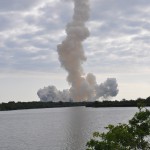
This is a gallery of the launch photos that I took in the ~20 seconds that we had between ignition and the space shuttle Endeavour disappearing into the clouds. I’ll set up an outside gallery of all of the 300+ photos that I took in the coming week or so. I hope you enjoy them as much as I am.

DeepZoom of Endeavour on the Launch Pad

[Zoom.it shut down, so my DeepZoom image is no longer available. I’ll re-create it soon…]

(The image above is dynamic and zoomable, play around with it some. Mouse over it and use your scroll wheel, click and drag around on the image, or click the plus and minus buttons, even go full screen with the button on the lower-right-hand corner – have fun with it!)

One of the challenges of taking photos of special events and places is that they always look so small and lacking in visual acuity and detail. You take a picture and then later, when you’re looking at it, you feel underwhelmed that it just doesn’t capture the clarity that you remember seeing.

Two technologies that I cobbled together to create the zoomable picture above of the Endeavour (STS-134) on the launch pad are Microsoft ICE (Image Composite Editor) and DeepZoom to tile and create javascript that allows you to zoom in and out of the image to enjoy much more detail. You can learn more about Microsoft ICE via this HD View blog posting, including details on what it can do as well as download links (it’s free!). I used my digital camera to zoom into the shuttle while it was on the launch pad post RSS shield retraction and took a matrix of photos, making sure that each photo overlapped with the others a little bit so that ICE could stitch them into one large hi-res photo. Since we’re limited in the number of pixels we can display on a screen, I leveraged DeepZoom technologies to break the image into a series of sub-images and to create javascript to swap in higher-resolution tiles as you zoom into the image. Similar to what you find when you zoom into a Google Map image or the like.

Microsoft had made it quite easy to automagically create DeepZoom images (based on SeaDragon technology) via their Zoom.it site. All I had to do was upload the composited image that I’d created using ICE to a web server, feed Zoom.it the URL of the large graphic image file and then copy the embed code from the results and paste them into this post after the file had been processed. The resulting javascript and tiles that were created are hosted on their site, so I didn’t even need to include them in my image file holdings.

I hope this helps in two ways:
A) Appreciate the awesome site that we were seeing at the STS-134 NASATweetup
B) You now know how to fish (ie: how to create cool visualizations like this). Have at it!

ps – If you want to pull down the full hi-res image that was used to create this so you can print out an awesome poster of the shuttle on the launch pad, you can get it here. Enjoy!

Endeavour Launch Photo Time Lapse

I took as many photos as I could during the Endeavour launch yesterday morning as fast as my camera would allow. Here is a time lapse of the photos taken before it disappeared into the clouds. I uploaded it to YouTube at 1080p, so make sure to go full-screen with it. Enjoy!

Update: Just found a link to a video that @AVWriter posted – crank up the subwoofer and enjoy the launch from the same vantage point that we had!

Conch Reef Survey for NASA’s NEEMO 15 Project

Dr. Art Trembanis’ Coastal Sediments, Hydrodynamics & Engineering Lab (CSHEL) has been pretty busy lately. Not long ago I did a post about the prototype sub-bottom profiler section that he added to his Autonomous Underwater Vehicle (AUV) (see: Sub-Bottom Profiling using an AUV). I was down at the NASATweetup for the Endeavour (STS-134) launch not long ago and I got chatting with some folks from NASA’s Open Goverment Initative about the NEEMO 15 project (NEEMO stands for “NASA Extreme Environment Mission Operations“) and we discussed UD’s involvement.

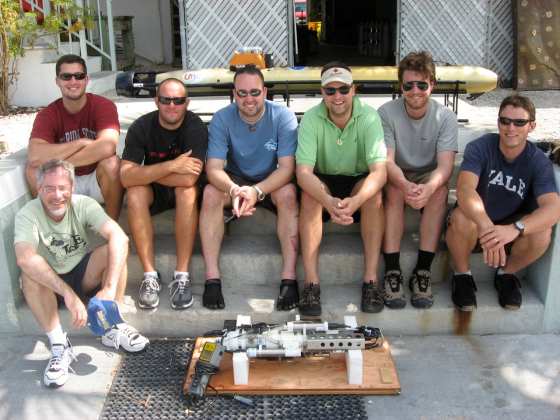
It takes a village of roboticists to run a successful AUV campaign

It takes a village of roboticists to run a successful AUV campaign

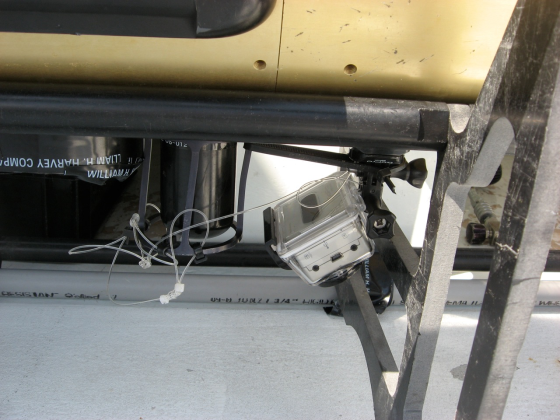
When I emailed Dr. Trembanis upon my return to Delaware, he emailed me back with instructions to browse to UNCW’s Life Support Buoy live webcam above the Aquarius Reef Base. Sure enough, he was there aboard the RV George F. Bond monitoring his Gavia Scientific AUV as it acoustically mapped the Conch Reef around the Aquarius as a precursor robotic mission for NEEMO 15.

Go Pro Hero Attached to the AUV

Go Pro Hero Attached to the AUV

Here is video footage shot by an off-the-shelf HD Go Pro Hero digital video camera that was attached to the AUV:

httpv://www.youtube.com/watch?v=8n3nR9TaVGo

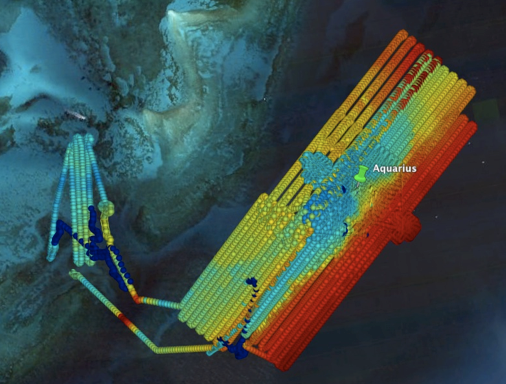
The mapping mission ran for 4 days and covered approximately 100km, resulting in about 15Gigabytes of raw data. Here’s an overview map of the mission.

Aquarius NEEMO 15 precursor survey

Aquarius NEEMO 15 precursor survey

Many thanks to Dr. Trembanis for the video and imagery to go along with the story. Be sure to visit NASA’s NEEMO site to learn more about the mission and what’s to come. Visit the CSHEL site to learn more about the research that’s going on there and to see other cool video and image products that they’re producing.

STS-134 NASATweetup is only half over

I’m back from the Kennedy Space Center and the first half of the STS-134 NASATweetup. We got through most of the activities slated for Day #1 – which included meeting the ~149 other #NASATweetup attendees, a demo of the Extravehicular Mobility Unit (EMU) and Mark III spacesuits, and talks by Dana Hutcherson (flow director), Tara Ruttley (ISS associate program scientist) and astronaut Clay Anderson (@Astro_Clay). They really rolled out the red carpet for us!

@CPUGuru, @FlatSamantha and @Astro_Clay

@CPUGuru, @FlatSamantha and @Astro_Clay

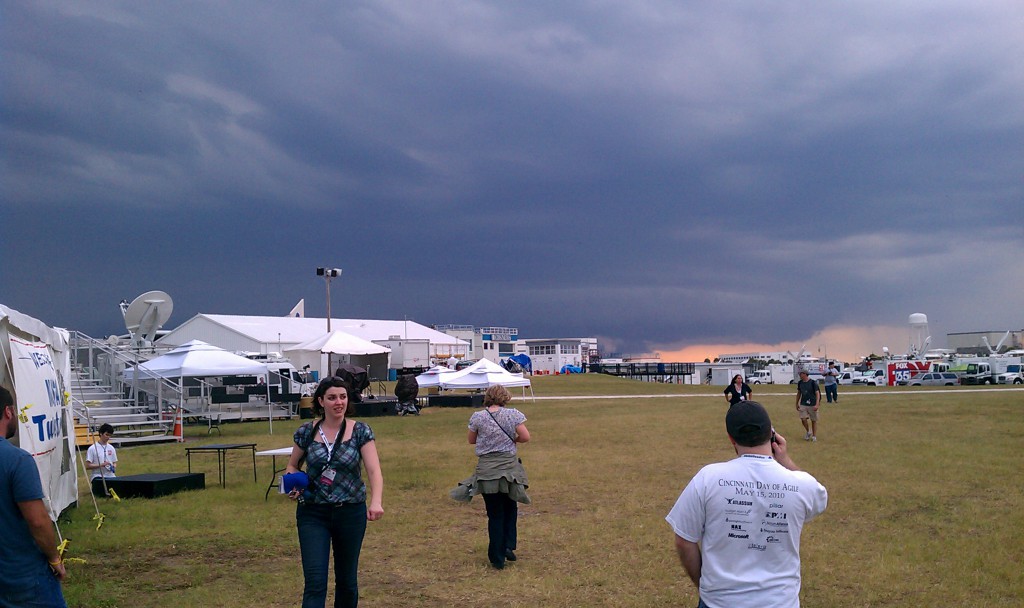
The second half of the day involved visits to the Shuttle Landing Facility and the Mate-Demate Device (big honkin’ crane and assembly to lift the shuttle onto and off-of the 747 that carries it), the Vehicle Assembly Building (the large picture behind us in the picture above) – also known as the “world’s largest single story building” in which they work on and assemble the shuttle, booster rockets etc. The last part of Day #1 was supposed to be a site visit to the shuttle itself to watch the retraction of the Rotating Service Structure (or RSS) but a rather nasty storm front presented itself and all sorts of dark clouds, rain and lightning ensued.

The Lightning Storm

The Lightning Storm

Retraction of the RSS was delayed from its original 7:00pm time to much later in the evening, so we missed being able to get up close and personal with the shuttle. By the time we arrived for “Launch Day” the following morning, the RSS had already been retracted and the fuel tanks were being filled with liquid oxygen, so we were unable to get any closer than the press site almost 3 miles away.

On Day #2 we had a group picture taken by the countdown clock and talks by astronauts Ricky Arnold (STS-119 Discovery) and Leland Melvin (@Astro_Flow – now associate director for Education at NASA). We also had a talk by Daire McCabe – a designer at Lego followed by a weather/launch update by Lt. Col. Patrick Barrett of the 45th Weather Squadron.

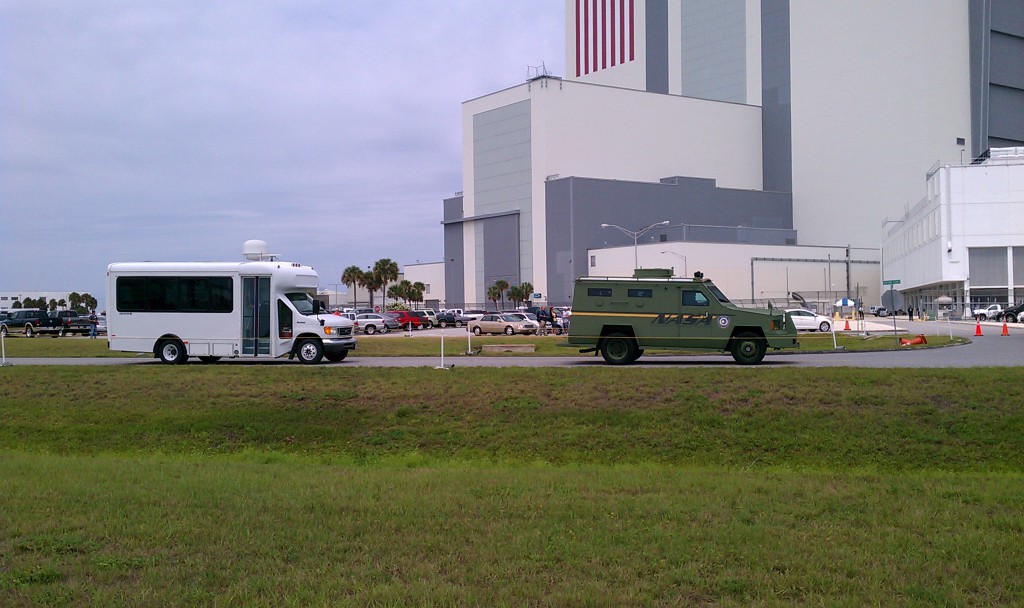
We all went out to the roadside in front of the Vehicle Assembly Building (VAB) to watch the caravan carrying the astronauts to Launch Pad 39A go by and wish them well, however the vans came, stopped, and turned back around (a first we’re told). Apparently a power coupling unit was not functioning on the shuttle and they scrubbed the launch. We were all a tad disappointed, but I heard a good quote along the lines of “it’s better to be on the ground wishing you were in the air than to be in the air and wishing you were on the ground”.

Caravan Carrying the Astronauts

Caravan Carrying the Astronauts

The current status is that they are in the process of replacing the faulty power coupling unit and that the earliest possible launch date is May 10th. Both @FlatSamantha and I (@cpuguru) plan on heading back down to KSC as soon as they tell us a definitive launch date. We’ll be sure to take some awesome pictures and will keep you informed once the second half of this #NASATweetup resumes. For a good timeline of the adventures of @FlatSamantha, be sure to follow her on her Twitter page, where she’ll keep you informed and upload pictures of what’s going on right then. Until then, we’re on hot stand-by, our bags are packed and we’re anxiously awaiting the good news that the launch is a go.

Flat Samantha Is Coming to the STS-134 NASA Tweetup

Flat Samantha

Samantha and her friend Flat Samantha

Flat Samantha is in the house! I was contacted by young Samantha (pictured left – the non-flat one) to see if I had room for Flat Samantha to ride with us to the Kennedy Space Center in Florida when we embark for the NASA Tweetup at the Space Shuttle Endeavour (STS-134) launch on April 29th. Today we met up with her and her parents and got instructions on how to take care of Flat Samantha.

Samantha has provided meticulous training to Flat Samantha and has crafted a first-class space suit along with a helmet to help her breath in space should the opportunity present itself.

During our pre-flight briefing, I gave her the run-down on what the travel plans will be. I promise to take good care of our new travel companion and will post pictures at every major step in our journey. Thanks for entrusting us with your friend Samantha! We’ll be sure to take good care of her and will return her to you safely when this adventure is over.

Flat Samantha is following the footsteps of some of her other flat siblings, including the original “Flat Stanley” who visited twice: once in 2002 when he went into space and did a 14-day mission on the space shuttle Endeavour and again in 2011 when he visited NASA HQ courtesy of Beth Beck.  Other flat adventurers include “Flat Paxton” and “Flat David“, who also had the opportunity to visit NASA.

Flat Samantha will be tweeting about her adventures at the #NASATweetup – you can follow her tweets via @FlatSamantha as well as mine at @CPUGuru. Welcome to the adventure Flat Samantha!

NASATweetup for the Final Endeavour (STS-134) Launch

Ocean Bytes AstroTweeter @cpuguru

Ocean Bytes AstroTweeter @cpuguru

It’s official – I’m heading to Kennedy Space Center in sunny Florida for the Space Shuttle Endeavour (STS-134) launch as part of what they call a “#NASATweetup”. I follow @NASA via my personal Twitter account – @cpuguru – and when they announced that they were accepting applicants for the 150 spots that could gain back-stage access to the Space Shuttle Endeavour’s final launch, I beat feet over to the site and entered the contest. Apparently there were over 4,000 applicants for these openings from around the world. It blew my mind when I finally got the email from NASA saying that I was selected. I am deeply honored to be included in this auspicious event.

What is a “NASA Tweetup” you ask? Well, according to the NASA Tweetup page:

“A Tweetup is an informal meeting of people who use the social messaging medium Twitter. NASA Tweetups provide @NASA followers with the opportunity to go behind-the-scenes at NASA facilities and events and speak with scientists, engineers, astronauts and managers. NASA Tweetups range from two hours to two days in length and include a “meet and greet” session to allow participants to mingle with fellow Tweeps and the people behind NASA’s Twitter feeds.”

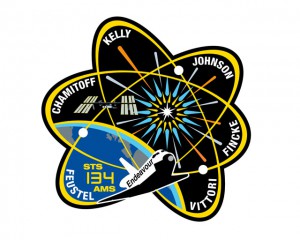
STS-134 Patch

STS-134 Patch

A list of the ~150 confirmed attendees of the #NASATweetup for space shuttle Endeavour’s launch can be found via the @NASATweetup/sts-134-launch list. A fellow attendee, @ChrisCardinal, has setup a comprehensive blog site that he’s using to post information pertinent to the launch and the STS-134 Tweetup at http://134tweetup.com. It’s been quite useful for tracking some of the behind-the-scenes information about the shuttle launch, as well as updates such as the delay of the launch from April 19 to a new (unless it changes again) April 29 launch date due to a overlap issue it would have with docking with the International Space Station by a Russian Progress supply vehicle. My understanding is that the delay came about because the Russian vehicle needed to be docked to the ISS during the same time frame as the Endeavour’s 14-day mission would have fallen. Apparently there are two docking ports on the ISS and the two vehicles could theoretically have been docked simultaneously, but I believe that process has not yet been fully vetted and approved yet so the safer alternative of delaying the shuttle launch was selected.

I’m taking you with me!

The bad news is that while I won the lottery to attend the NASA Tweetup, I am unable to physically take anybody else with me. The GOOD news is that doesn’t mean that you can’t come with me virtually. I’m brainstorming on what kinds of equipment I can pull together that would allow me to share as much of this experience with you as I can through the magic of modern portable electronics. I want to cobble together a high-def webcam and perhaps a tablet or laptop so that I can record (and maybe live stream) my adventure ala Hat Cam Guy (aka Joel Glickman). Since I don’t have an iPhone to hot-glue to my ball cap, I might have to rely on the generosity of others to help me pull this off. If you have some equipment and/or resources you’d like to donate to the cause please let me know by emailing me at 134Tweetup@oceanic.udel.edu.

Q&A for NASA

If you look in the menu above, you’ll see that I added a page called “Q&A for NASA” so that school kids (and adults ;?) can post questions that they’d like me to try to get answers for while I’m down there. If you have a question that you’d like me to try and find an answer to, please feel free to add it in a “comment” to the page and I’ll do my best to get it answered while I’m down at the Kennedy Space Center.

Government Shutdown?

Now we are apparently going to be playing the “chase the launch date” game as we worry about the possible impact that a US Government shutdown would have on the launch due to the lack of a budget from Congress. I’ve been following the Twitter hashtag “#NASATweetup” and keeping a watchful eye on what the latest rumors are as to whether the mission will be delayed from its current April 29 launch date if funding isn’t allocated to keep governmental operations rolling. I’m crossing my fingers and hoping that Congress can get matters worked out.

A HUGE shout-out to Tammy!

I’ve been emailing back and forth with our awesome Marine Public Education Office team about this incredible opportunity to reach out and help educate and include kids in this adventure. I mentioned that it would be cool to include more of a space theme in the Ocean Bytes header image and in the time it took me to drive home I had the awesome header image that you see above in my inbox from our incredibly talented Tammy Beeson. Tammy ROCKS!

Polar Orbiting Satellite Receiving Station

The video above is a quick screencast NASA JPL’s Eyes on the Earth application, which shows the tracks of various satellites orbiting the globe. It’s a really cool application that gives a top-notch overview of some of the satellites currently in orbit and their trajectories around the Earth. Take some time and poke around, you’ll be glad you did.

Polar Satellite RadomeThe reason I included it is that I promised to cover the polar orbiting satellite receiving station in a previous blog post about the new Satellite Receiving Station in Delaware. In the previous post I discussed the geostationary satellite receiving station. In this post, I hope to shed some light on the polar orbiting receiving setup.

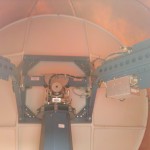
What’s Inside the Radome

MODIS Satellite PassThe equipment for the polar orbiting satellite receiving station is a bit more involved than the pretty much non-moving geostationary setup. As the name implies, the polar orbiting satellites do just that, they orbit the Earth north and south, going from pole to pole. Their path is relatively simple, they just go around the earth in circles, but as they’re doing so, the Earth is rotating beneath them. The satellites point their cameras towards the earth and essentially capture a swath of data during each rotation. Since the Earth is rotating beneath them, the swath appears as a diagonal path if you look at the overlay.

Inside the RadomeIn order to capture data from a moving target, the dish has to be able to rotate and move in three axis in order to follow the satellite of interest. In order to protect the receiving equipment from the weather, it is typically installed in a circular fiberglass enclosure called a “radome”. To keep the design relatively simple, there is only one mounting configuration and radome setup created, and that’s designed to mount onboard a ship. It is then relatively simple to attach a mounting bracket to the top of a building and bolt the radome assemgly to it.

The video at the top of the page shows that there are several satellites in orbit, so the Terascan software has to pull down satellite ephemeral data from Celestrak each day, take into account the location of the tracking station, and generate a calculated schedule of which satellites will be visible to the satellite dish throughout the day. As there may be more than one satellite in view during any given time period, the satellite operator assigns a priority weighting to each satellite. The Terascan software then uses that weighting to decide which satellite it will aim the dish at and start capturing data.

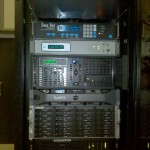
Receiving Station Workstations

Acquisition and Processing SystemsInside the building is a rack of computers and receivers whose purpose in life is to control the dish on the roof of the building and to receive and process the data it relays down from the satellite. The receiving station at UD has both X and L-Band receivers which receive the data stream and pass it to a SeaSpace Satellite Acquisition Processor. The processor then sends the data packets to a Rapid Modis Processing System (RaMPS) which combines the granularized HDF data files from the satellites into a TeraScan Data File (TDF) file. Once in this format, various programs and algorithms can be run against the TDF file and channels of interest can be combined using NASA/NOAA and other user supplied algorithms to create the output product of interest. As the files can get rather large and there can be several of them coming in throughout the day, they are then moved over to a Networked Attached Storage (NAS) server and stored until they are needed.

Satellites Licensed

The UD receiving station is licensed and configured to receive data from the following satellites:

  • Aqua
  • Terra
  • NOAA 15
  • NOAA 17
  • NOAA 18
  • NOAA 19
  • MetOp-A (Europe)
  • FY-1D (China)

Hopefully this sheds a little more light on the polar orbiting receiving station and its capabilities. Let me know if there are any additions or corrections to the information I’ve posted.

New Polar and Geosynchronous Satellite Receivers for Delaware

A few weeks ago they fired up a new satellite receiving station from SeaSpace at the University of Delaware’s main campus in Newark, DE. Two receivers were brought online, one for L-Band reception from Geosynchronous Satellites and one for X/L-band reception from Polar Orbiting Satellites. Both receiving systems have dishes that are mounted on the roof of Willard Hall as it presented the least obstructed view of the sky. The adds additional capability to an east coast satellite operations contingent which includes:

  • University of Maine
  • City College of New York
  • Rutgers University
  • University of Delaware
  • University of South Florida
  • Louisiana State University
  • Purdue University

For this blog posting, I’ll only cover the geosynchronous satellite capabilities. In a future posting I’ll cover the polar orbiting hardware and its capabilities.

Geosynchronous Satellite

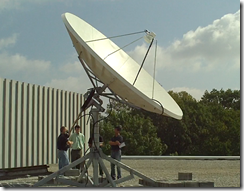
UD Geosynchronous Satellite Dish

The beauty of geosynchronous satellites is the simplicity with which they can be tracked. Rather than flitting all about and requiring fancy calculations and equipment to track them, you merely point the dish to a point in the sky where the satellite remains fixed relative to the motion of the earth and pretty much lock the receiving dish down. Since the satellite is moving with a trajectory and speed that matches the rotation of the earth, the satellite is said to be “geo-stationary”.

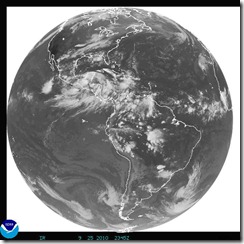
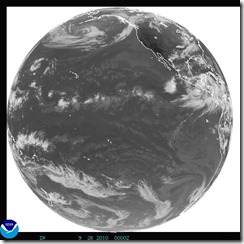
The dish used to receive the signals from the geosynchronous satellites is therefore simple in its design. It is mounted with only one axis of movement, meaning it can only be adjusted along an arc of the sky either to the east or to the west. There is a motor and lead screw mounted on the back that will either push the dish one way, or pull the dish the other in order to position it for the best signal strength. The current intent of the UD dish seems to be dedicated to constantly receiving real-time data from the GOES-EAST satellite (also known as “GOES-13”). GOES East outputs full disk imagery of the the earth from a longitude of 75 degrees west, which gives a good view of pretty much all of North and South America and a good chunk of the Pacific and Atlantic Ocean.

GOES stands for “Geostationary Operational Environmental Satellite” and it is operated by NOAA’s NESDIS or “National Environmental Satellite, Data, and Information Service” primarily to support meteorological operations and research, which includes weather forecasting and storm tracking. The dish is oriented in such a way that it could also be programmed to point to GOES-WEST (aka GOES-11)  for a satellite view of the Pacific Ocean (centered around 135 degrees west longitude) as well if the need arises.

GOES East Full Disk Infrared GOES West Full Disk Infrared

GOES Sensors

One thing to bear in mind is that GOES-13 hasn’t always been “GOES East” – it took over for GOES-12 in April 2010, with GOES-12 moving to 60 degrees West to replace GOES-10 (decommissioned) for coverage of South America. I note this so that you don’t assume that the sensors (and/or their calibration factors)  for a particular GOES station are always the same.

Imager

The current GOES-East has optical imagers with 6 channels with resolutions of 1.1km for the visible channel (one); and 4km and 8km resolutions for the near infrared, water vapor and thermal infrared channels (two through six). The imager is basically a rotating mirror and lens configuration that scans the earth from north to south, line by line to receive reflected visible light, water vapor as well as infrared radiation channels. Each line scanned is digitized and transmitted back towards the earth with measurement units of percent albedo for visible light and temperature for the water vapor and infrared information. Spectral response functions can now also be downloaded online from the NOAA Office of Satellite Operations as well as other GOES calibration information.

Sounder

GOES satellites are also equipped with a sounder with 8km resolution. The sounder scans the atmosphere over the land and ocean and provides vertical profiles which include the temperature of the surface and cloud tops as well as derived wind velocities from these measurements.

Real-time Access to Data

The key feature to having a satellite receiving station on-site is the access to the raw, real-time satellite data. Sure, you can get pull some images down from the NOAA Geostationary Satellite Server, but they would be just derived images. Scientists here at UD and elsewhere are interested in getting the latest raw data feeds from the satellites so that they can research and develop algorithms that process the raw channel data into other products in support of their research projects.

Next on my agenda is to try to give some insight into the polar orbiting satellite tracking station and the fancy gear that sits inside the radome enclosure. Cheers!

Turning Satellite Data into Google Earth Maps: It’s Easy!

As a new grad student in the ORB (Ocean exploration, Remote Sensing, and Biogeography) lab at the University of Delaware under Dr. Matthew Oliver, I (along with my cohort Danielle Haulsee) were tasked with learning to write code in R.  R is a language that enables statistical computing and making graphical displays. To some of you this may sound basic, but having no prior programming experience it was a little overwhelming at times.  After getting the basics down, we then started pulling sea surface temperature and chlorophyll data from NASA’s Goddard Space Flight Center (GSFC) MODIS Aqua satellite.  This isn’t just any temperature and chlorophyll data either, it’s real-time and updated everyday!  From this we were able to create maps on Google Earth, which is a great platform for viewing and interacting with multiple data layers on a global scale.  This allows us to easily distribute NASA’s data for ocean planning.  These overlays along with others were also able to assist in planning Slocum Glider missions in areas surrounding the Gulf oil spill.

In our Google Earth maps, we created 1, 3, and 8 day averages that reflect the current conditions in the ocean.  Each day our code downloads the lastest satellite data that has been updated on NASA’s website and then it is averaged along with the previous days to create an average. The 1 day average maps are patchy due to the fact that the satellites can not see through the clouds.  Therefore, the 8 day averages make for a more complete and accurate picture.  For higher resolution images, we created smaller maps of just California, the East Coast and even Antarctica!  These locations correspond to areas that we conduct further research in.   Google Earth was interested in our overlays so check out the Google Earth Gallery for sea surface temperature and chlorophyll concentrations near you!

© 2024 Ocean Bytes Blog

Theme by Anders NorenUp ↑