Category: Research Vessels/Ships

Where Have All The Research Vessels Gone?

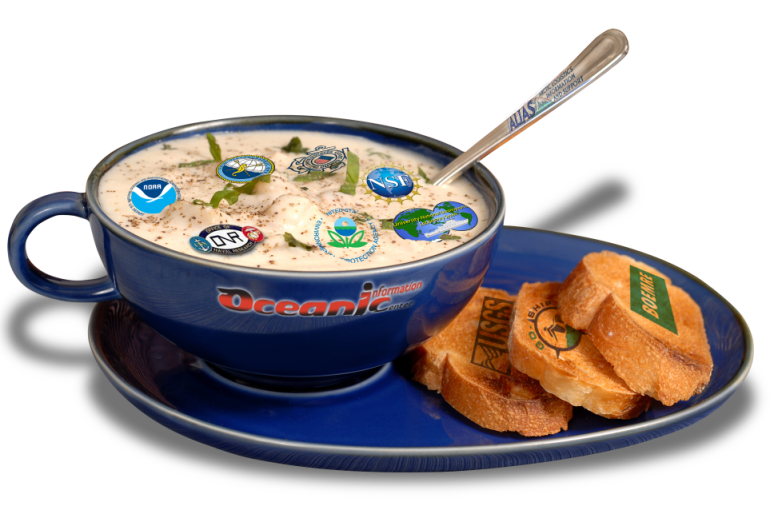
That’s the question that we hope to answer with the International Research Ships Schedules & Information project. Imagine with me if you will a site where we can log metadata about the research adventures of all oceanographic research vessels. Think of the opportunities that it would open up for researchers wanting to know who has been exploring in a specific region of the ocean, what they were looking for and, if we can get the metadata exposed, what data they collected with possible links to where it can be discovered. I’m proposing that we continue to develop the pot where all of that ship information and cruise metadata can be cooked, blended together with just the right seasonings (algorithms), and develop the scoops (tools) that would help users, agencies and researchers pull out a portion that suits their needs. I like to call the concept Stone Soup Science. I love the Stone Soup story and think the concept that it conveys in this data context is a perfect fit. (It’s much better than my other depictions – “Show Me The Data!” or <cue AC/DC music>”Dirty Data…Done Dirt Cheap”  ;?)

Stone Soup Science graphic

Stone Soup Science

No, I am not proposing that we build a data warehousing site to hold all of the oceanographic data that’s being collected. There are agencies and organizations all of the world that are doing a great job of doing that already. What I am proposing is that we continue the modernization of the Research Vessels site to help users mine for and discover where RVs have operated in the past. The next step would be to expose links to those data warehouses. I certainly wouldn’t want to have to try to comb through the holdings of NOAA, R2R, IFREMER, CSIRO, etc to find out who has been doing what oceanographic research, where they went and when they were there. I think this is a better one-stop RV shop solution. All research vessels would be added to the site, not just vessels over a certain size, not just vessels that belong to a certain agency, not just vessels that specialize in one facet of science. We can create customized views of those most certainly, but they’d be done by creating queries to the vessel database to return just those vessels that are of interest to the user or association.

A students Ocean Bytes article shows one of the benefits of being able to leverage and repurpose underway ships data. Eric Geiger pulled together the underway surface mapping data from four regional research vessels to create his satellite salinity modelling algorithm as part of his research thesis. It took Eric a significant amount of time to figure out what research vessels had been working in the region that he wanted to investigate, and even more time to be able to get access to the data that the ships had collected. Imagine if we were able to put together a set of online tools that facilitated that type of investigation. That’s part of what we hope to accomplish with the International Research Vessels Schedules & Information site.

Rather than regurgitate the information on the history and future modernization thoughts on International RV project, I’ll refer you to the About Ships page, which does a pretty good job of explaining things.

International RV Tracks 2002-2011

International RV Tracks 2002-2011

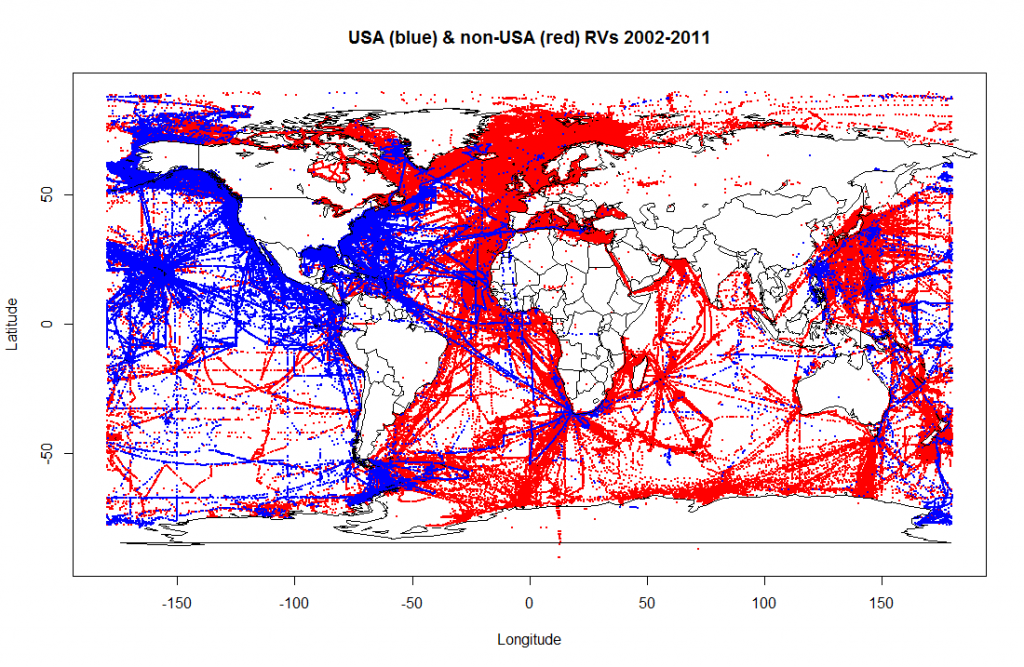
The visualization above was a plot that I made of a subset of research vessel cruise tracks from 2002-2011. In blue are the vessels designed as US RVs and in red are the non-US vessels. I think it’s quite intriguing to be able to visualize the locations where we are conducting research, transiting to the location where we plan to research (sensors still collecting underway data) and, sometimes more telling, the gaps in coverage where nobody seems to be going. Many thanks to SailWX.info for the data dump.

RV Hugh R Sharp Ship Track

RV Hugh R Sharp Ship Track

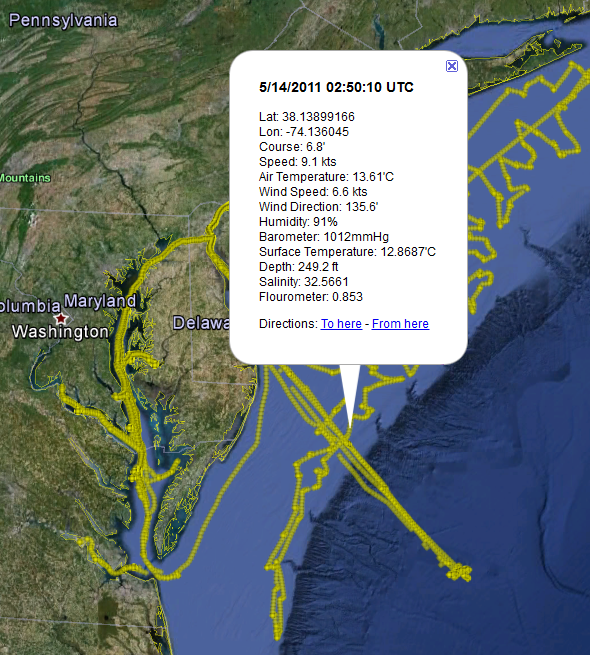
A couple of years back, we helped the RV Hugh R Sharp set up a ship-to-shore data transfer mechanism up using their newly acquired fleet broadband. Every hour or so, the transfer scripts zip up the ships underway data files and transfers the data ashore. It dawned on us that we could peek inside the data archive sent ashore, parse out a subset of the ships underway data in 10 minute intervals, and display the ship track and its underway data in near real time. The RV Sharp Ship Tracker site was born out of this effort (see screenshot above). We’d like to prototype a more user customizable open source version of this code and allow others to use the code for their own ships. This data feed could then be pulled into the Research Vessels site to show a higher resolution ship track for the RVs that participate as well as exposing the ships underway data for possible re-use by other students and researchers. For those institutions that already have a ship tracking application in place, we could develop services that would allow for harvesting and repurposing those data as well. The thought would then be to expose all of the ship information, schedule and track metadata via a web api that would allow others to use and repurpose the data as well. Whether it be on their own sites, displaying just a subset of the ships that they are interested in, or for use on mobile apps. Open data!

No Funding

I’ve been involved in the development and operation of the International Research Vessels Schedules & Information project since around 1998 or so. The project was previously funded by a collection of sponsors including NSF, NOAA, ONR, NAVO and the USCG, with each of them contributing funds towards the operation of the project until around 2005. Budget cuts at the time plus the reluctance to share upcoming ship schedules post 911 by some agencies resulted in our program losing its funding. I put the project into hot-standby until funding could be obtained to resume project development and metadata collection. The site stayed online and new ship information was added as it was received, but no major reworks of the site underpinnings happened. I’ve done the dog-and-pony show showcasing the site and its potential to a few groups since then attempting to get funding to move forward and while nearly everybody seemed to agree that the project should be funded, no funding ever came.

Web technologies are advancing at breakneck speeds and it’s time to move this project forward. Funding or no funding. (It’s either that or start working on a Flappy Ships app, make millions, but not contribute towards science ;?)

I’m always open for more help and ideas to maximize the projects capabilities and potential, so if you’d like to lend a hand, do some research, contribute some code, or offer up some other resources (funding, software, training), please let me know by emailing me at info@oceanic.udel.edu. The project needs re-architecting, the data tables need normalizing/denormalizing, the web design needs to be majorly spruced up, new GIS/mapping strategies and tools need to be figured out, ship data needs to be refreshed, web APIs need to be written, etc. Lots to do!

Help me help science!

Doug White

Predicting Sea Surface Salinity from Space

The simplest definition of salinity is how salty the ocean is. Easy enough, right? Why is this basic property of the ocean so important to oceanographers? Well, along with the temperature of the water, the salinity determines how dense it is. The density of the water factors into how it circulates and mixes…or doesn’t mix. Mixing distributes nutrients allowing phytoplankton (and the rest of the food web) to thrive. Globally, salinity affects ocean circulation and can help us understand the planet’s water cycle. Global ocean circulation distributes heat around the planet which affects the climate. Climate change is important to oceanographers; therefore, salinity is important to oceanographers.

Spring Salinity Climatology for the Chesapeake

Spring Salinity Climatology for the Chesapeake

Salinity doesn’t vary that much in the open ocean, but it has a wide range in the coastal ocean. The coast is where fresh water from rivers and salt water in the ocean mix. Measurements of salinity along the coast help us understand the complex mixing between fresh and salty water and how this affects the local biology, physics, and chemistry of the seawater. However, the scope of our measurements is very small. Salinity data is collected by instruments on ships, moorings, and more recently underwater vehicles such as gliders. While these measurements are trusted to be very accurate, their spatial and temporal resolution leaves much to be desired when compared to say daily sea surface temperature estimated from a satellite in space.

So, why can’t we just measure salinity from a satellite?Well, it’s not as simple, but it is possible. NASA’s Aquarius mission http://aquarius.nasa.gov/ which was launched this past August is taking advantage of a set of three advanced radiometers that are sensitive to salinity (1.413 GHz; L-band) and a scatterometer that corrects for the ocean’s surface roughness. With this they plan on measuring global salinity with a relative accuracy of 0.2 psu and a resolution of 150 km. This will provide a tremendous amount of insight on global ocean circulation, the water cycle, and climate change. This is great new for understanding global salinity changes. What about coastal salinity? What if I wanted to know the salinity in the Chesapeake Bay? That’s much smaller than 150 km.

That’s where my project comes in. It involves NASA’s MODIS-Aqua satellite (conveniently already in orbit: http://modis.gsfc.nasa.gov/), ocean color, and a basic understanding of the hydrography of the coastal Mid-Atlantic Ocean. Here’s how it works: we already know a few things about the color of the ocean, that is, the sunlight reflecting back from the ocean measured by the MODIS-Aqua satellite. We know enough that we can estimate the concentration of the photosynthetic pigment chlorophyll-a. So not only can we see temperature from space, but we can estimate chlorophyll-a concentrations too! Anyway, there are other things in the water that absorb light besides phytoplankton and alter the colors we measure from a satellite.

Spring Salinity Climatology for the Mid-Atlantic

Spring Salinity Climatology for the Mid-Atlantic

We group these other things into a category called colored dissolved organic material or CDOM. CDOM is non-living detritus in the water that either washes off from land or is generated biologically. It absorbs light in the ultraviolet and blue wavelengths, so it’s detectable from satellites. In coastal areas especially, its main source of production is runoff from land. So, CDOM originates from land and we can see a signal of it from satellites that measure color. What’s that have to do with salinity?

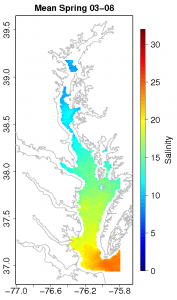
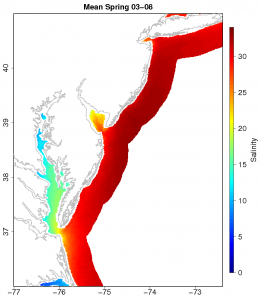
You may have already guessed it, but water from land is fresh. So, water in the coastal ocean that is high in CDOM should be fresher than surrounding low CDOM water. Now we have a basic understanding of the hydrography of the coastal Mid-Atlantic Ocean, how it relates to ocean color, and why we need the MODIS-Aqua satellite to measure it. So, I compiled a lot of salinity data from ships (over 2 million data points) in the Mid-Atlantic coastal region (Chesapeake, Delaware, and Hudson estuaries) and matched it with satellite data from the MODIS-Aqua satellite in space and time. Now I have a dataset that contains ocean color and salinity. Using a non-linear fitting technique, I produced an algorithm that can predict what the salinity of the water should be given a certain spectral reflectance. I made a few of these algorithms in the Mid-Atlantic, one specifically for the Chesapeake Bay. It has an error of ±1.72 psu and a resolution of 1 km. This isn’t too bad considering the range in salinity in the Chesapeake is from 0-35 psu, but of course there’s always room for improvement. Even so, this is an important first step for coastal remote sensing of salinity. An algorithm like this can be used to estimate salinity data on the same time and space scale as sea surface temperature. That’s pretty useful. The folks over at the NOAA coastwatch east coast node thought so too. They took my model for the Chesapeake Bay and are now producing experimental near-real time salinity images for the area. The images can be found here: http://coastwatch.chesapeakebay.noaa.gov/cb_salinity.html. They will test the algorithm to see if it is something they want to use

Climatologies of salinity for all of my models can be downloaded here: http://modata.ceoe.udel.edu/dev/egeiger/salinity_climatologies/.

I view this project as an overall support of the NASA Aquarius mission by providing high resolution coastal salinity estimates that are rooted in in situ observations. I hope this information proves to be useful for coastal ocean modeling and understanding the complex process that effect the important resource that is our coasts.

Demobilization and Remobilization of the Hugh R Sharp

Summer is an especially busy time for research vessels. The UNOLS fleet is making increasing use of containerized portable lab vans to shave some time and effort off of offloading the science party from one cruise and loading up the next mission and their gear. They also increase the flexibility of the research vessels by giving them the option to add additional science capabilities and facilities to vessel users. Options include adding:

  • Dry Labs
  • Wet Labs
  • Isotope Labs
  • Clean Labs
  • Cold Labs
  • Additional Berthing

This is a time lapse that we shot of the RV Hugh R Sharp returning from a multi-week scallop survey, unloading one lab van and then loading two more fresh ones before fueling up (both diesel and food) and departing on the next mission. Enjoy!

OSU Ships Underway Data System

One of the highlights of going to the RVTEC meeting is getting to hear about some of the cool projects that are underway at the various institutions. One talk that caught my attention was the SUDS system, an NSF sponsored project that was given by the techs at Oregon State University.

I talked David O’Gorman and Toby Martin into doing a quick rundown on their SUDS system on camera during one of the breaks. SUDS is an acronym for the Ships Underway Data System, which consists of software and two data acquisition boards that they designed in-house – one analog and one digital. Each board can be programmed with metadata about the sensors that are attached to them. When the boards are plugged into the ships network they broadcasting XML data packets which include both data and metadata about the data via UDP for a back-end data acquisition to capture and store. For redundancy, there can be multiple acquisition systems on the network as well I’m told.

The data acquisition cards can be either powered directly or via POE (Power Over Ethernet). They can also supply power to the sensor if needed. The digital cards can accept RS232 and RS485. The analog has 4 differential input channels which can do 0-5v on two of the channels and 0-15v on the other two and range from 600Hz to 20kHz input signals.

Their website has links to a PDF of the presentationthey did at the 2010 UNOLS RVTEC meeting as well as various examples of data packets that the system broadcasts. Definitely something that could be quite useful to handle the ever-changing data acquisition needs on today’s research vessels. I look forward to learning more about the SUDS system in the days to come.

UNOLS RVTEC 2010

RV HSBC Atlantic Explorer

RV HSBC Atlantic Explorer

Just got back from the 2010 UNOLS RVTEC meeting, which was held at the Bermuda Institute of Ocean Science (BIOS) – home of the RV HSBC Atlantic Explorer.

(Acronym Police: UNOLS = University-National Oceanographic Laboratory System and RVTEC = Research Vessel Technical Enhancement Committee).

For those unfamiliar with RVTEC, it is a committee organized around 1992 to “provide a forum for discussion among the technical support groups of the National Oceanographic Fleet” in order to “promote the scientific productivity of research programs that make use of research vessels and oceanographic facilities and to foster activities that enhance technical support for sea-going scientific programs” as listed in Annex V of the UNOLS charter. Membership is extended to UNOLS member institutions but “Participation shall be open to technical and scientific personnel at UNOLS and non-UNOLS organizations”.

The meeting agenda was pretty intense and we were pretty much straight out from Monday through Friday afternoon. There were a lot of scary smart people in the room doing some pretty amazing things in support of science operations at their respective institutions. I tried to compile a list of Tech Links on the ResearchVessels.org site to make it easier to find some of the various resources that were discussed at the meeting. I did the same thing at last years RVTEC meeting in Seattle but some additions and corrections were needed based on feedback from the members. I’m hoping that I’ll be able to obtain funding to attend next years meeting and perhaps the upcoming Inmartech meeting (look for a post on Inmartech soon).

I shot some video, made some fantastic contacts and had some interesting discussions at this years RVTEC meeting. If all goes smoothly, I’ll have a couple of new blog entries online this week to help share some of the wealth of knowledge.

3DVista Panoramic Tour of the Sharp

I tinkered around with a demo copy of the 3DVista Stitcher and 3DVista Show 3.0 to push its capabilities a tad. I touched on the packages in a previous blog post about the Global Visualization Lab where I did a simple panorama of the room. The wheels started turning and we decided to push the envelope a little and create a series of panoramic views of the RV Hugh R Sharp as a proof of concept for an online virtual tour of a research vessel.

Panoramic Tour of the RV Hugh R Sharp

Click on this image to visit the proof-of-concept panorama…

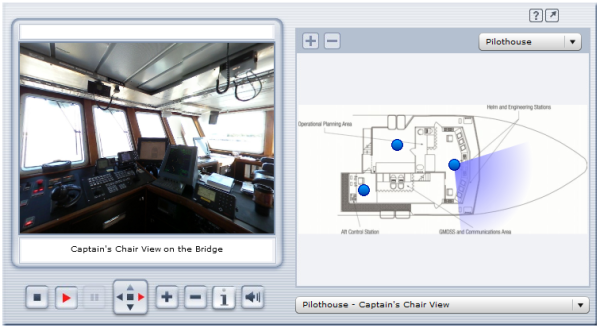
The image above is a screen shot of the proof-of-concept panoramic tour we came up with. Click the image above or this hyperlink to visit the actual panoramic tour. The pane on the left shows an interactive panorama of the various points of interest on the ship. The right-hand pane shows a scan of the deck and compartment that the panorama represents. If there is no user action, the tour will cycle through a complete 360 view of each panorama and will move onto the next panorama in the list if nothing is clicked. There are two drop-d0wns to the right, one above the deck layout to select a specific panorama and one below it to select a specific panorama.

A really cool feature of the product is the ability to take the panorama full-screen for a more immersive experience. To do so, just click on the arrow button in the top-right-hand corner next to the question mark symbol. Once in full-screen mode, you can easily cycle through the various pano’s by mousing over them near the bottom of the screen.

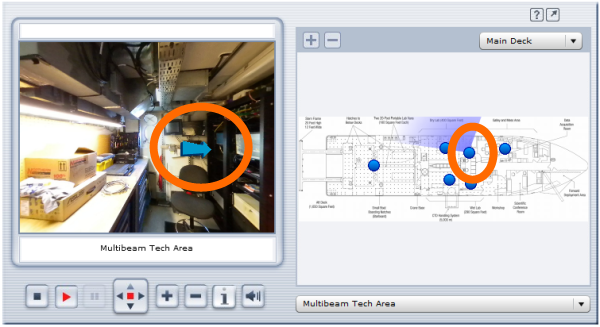
The 3DVista Show software allows you to insert hot-spots into the panorama’s as well that can either link to other pages/sites or to include an audio clip into the mix. This makes it quite easy to include additional information about a specific area or feature. I inserted an animated arrow pointing to the Multibeam Operator Station on the Main Deck -> Multibeam Tech Area that links out to the Reson Seabat 8101 Multibeam Echosounder posting.

Multibeam Tech Pano

The mind races with the various uses for this type of technology. It allows for mobility impaired individuals and class groups to tour a space that they’d ordinarily be unable to access. It also allows scientists to “look around” and get a feel for the spaces that they’d be using when they come onboard a vessel. For a future project, I’d like to get support do some panorama’s both inside and outside of the various UNOLS lab vans that would allow scientists to virtually stand in the lab vans and walk around them to see how they’re laid out. 3D panorama’s of research sites in remote locations like the arctic and antarctic also come to mind as does tours of mineral sample and other collections with hotspots included for the various specimens for links to additional information. The application of this tech abounds.

I talked with the folks at 3DVista and it looks like they offer a 15% academic discount for the software so be sure to ask about if if you’re going to purchase it. They also list a one-shot 360 degree pano lens and adapters to make shooting the digital pics a little easier. We used a 180 degree fish-eye lens for our pano shots, which means we did 3 shots at each location 120 degrees off from one-another and stitched them together with the 3DVista Stitcher program.

Many thanks to Lisa Tossey for taking the photos and getting this project rolling. I posted this as an unpolished proof-of-concept version. I look for the ready-for-prime-time panorama that she comes up with for the CEOE site. I also look forward to seeing any cool panoramas that are out there for research projects. Be sure to share your links.

Small & Mighty Mini-Top Barebones NetPC

What came in the box

MiniTop Contents

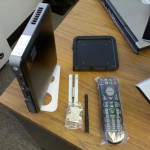
I thought I’d take a minute to share some info on the small and mighty Mini-Top barebones system from Jetway Computer. (Not to be confused with the Small & Mighty Danny Diaz ;?) This unit is basically the guts of a netbook but without the screen so I’ll call it a NetPC. We are thinking about introducing them into the computing site here at work and I was pretty impressed by its feature set and tiny size. Keep in mind that there are several models of ITX barebone systems to choose from over at Jetway. We opted to go with the model JBC600C99-52W-BW, which retails for about $270 at NewEgg. The “-BW” at the end means that it ships with a metal bracket (shown in front of the included remote in pic above) that will allow you to mount the unit to the VESA mounts on the back of most LCD monitors.

Minitop size photo

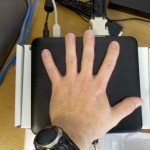
Smaller than my hand

Since the unit is so small (see pic to the right) this allows you to tuck it it out of the way quite easily behind a monitor. It also comes with an angled metal bracket that allows you to stand it up on its end and stick-on rubber feet in case you want to lay it on its side. Note that this is a “barebones” system, which means that it’s up to you to add the memory (up to 4Gigs of RAM), a single interior hard drive (2.5″ SATA) and a monitor to the mix. We purchased a 60Gig OCZ Agility 2 SSD (solid state drive) to the unit and a couple of Gigs of DDR-2 800/667 SODimm memory to the box (purchased separately).  The unit comes with a driver CD that has both Windows and Linux drivers on it, but since the unit doesn’t have an optical drive you’ll need to copy them to a thumb drive to use them. You’ll also need to figure out how to install an operating system on the unit as well. In our case, since we were installing Windows 7, we used the Windows 7 uSB/DVD Download Tool to take an ISO file version of our Windows 7 install DVD and create a bootable thumb drive with the Win7 install DVD contents on it. Installation was easy peasy.

Hardware specs are pretty impressive given its low cost and small size:

  • Intel Atom Dual-Core 525 CPU
  • nVidia ION2 Graphics Processor
  • DVI-I and HDMI 1.3 video outputs
  • Integrated Gigabit Ethernet & 802.11 b/g/n wifi
  • 12V DC 60W power input so it can be easily run off battery or ships power
  • Microphone and Headphone connectors
  • LCD VESA mount (-BW model only)
  • Jetway handheld remote control
  • USB 2.0 ports (5) and eSata connection

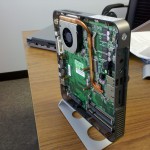
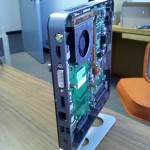
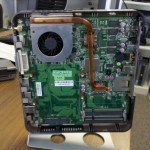
As I mentioned, we’re investigating using these as replacements for some of the computing site computers. We installed Windows 7 on the system and between the dual-core Atom processor and the SSD I can’t tell any difference between performance on this system and the Core-2 Duo desktops that are already in the site. Other possible uses include as a thin client, a kiosk PC, a set-top box for large wall mounted LCD displays and as a small low-power PC aboard ship or inside buoys or other deployed equipment. The unit has both DVI and HDMI outputs, so you can easily drive a small LCD or a huge flat-panel TV as long as they have those inputs (as most do). The nVidia ION-2 graphics system will supposedly drive a full 1080p HD display. I took some pics of the units interior (below) so you can have an idea of how the systems are laid out inside and out.

MiniTop Front Interior View

Front Interior View

MiniTop Rear Interior View

Rear Interior View

MiniTop Side Interior View

Side Interior View

These aren’t the only mini-PCs on the market. There are others like the Zotac ZBox and the Dell  Zino HD and I’m sure plenty of others. They’re just the model that we’re playing with here at the college. Exciting times ahead as these units ramp up in performance and drop down in size and power draw.

Video Tour of the Research Vessel Hugh R Sharp

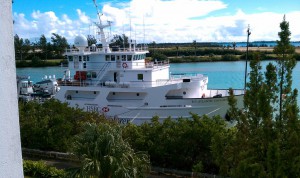
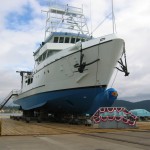
RV Hugh R Sharp ready for launchWe recently had guests come down to take a tour of the Lewes campus and the Research Vessel Hugh R Sharp. One of the guests was wheelchair-bound and was limited to only seeing the main deck of the ship as getting to the rest of the ship would have required going up and down stairs. The Sharp has accommodations for handicapped scientists, but they are pretty much limited to the main deck. This limits their access to just the aft working deck, the wet and dry labs, the galley and the conference room. The wheels started turning during that tour on how to share the rest of the technological awesomeness of the Sharp with others. I decided to take my trusty $100 video camera in hand and record a video tour of the ship for those that are unable to navigate the stairs, and for classrooms and visitors who just can’t make the trek to Lewes for a tour. It’s a tad long, running just over 40 minutes or so, but it covers almost the entire ship. Enjoy!

Many thanks to Captain Jimmy Warrington for taking time to do a whirlwind tour just prior to a science mission – as you can tell from the video, he’s a natural at relaying information about the RV Hugh R Sharp and its science capabilities.

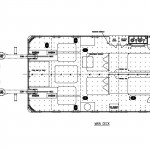
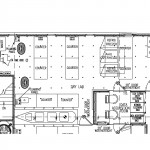
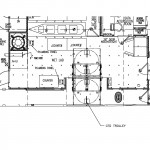
Detailed drawings showing deck layouts and profiles of the Sharp can be found the RV Hugh R Sharp landing page, which includes PDFs of:

To help you orient yourself a little bit as to the spaces that were covered, here are some deck diagrams to show the overview of a few of the spaces.

SHARP-AftDeck

Aft Deck

SHARP-DryLab

Dry Lab

SHARP-WetLab

Wet Lab

Caley Ocean Systems CTD Handling System


One of the interesting innovations on the RV Hugh R Sharp is the incorporation of a “CTD Handling System” from Caley Ocean Systems. The video above was taken from the wet lab of a CTD Rosette being deployed and recovered using this system. If you search around on YouTube, you can find some interesting videos of crews deploying and recovering the CTD Rosette system. What you typically find is that you have one crane operator and then two or three crew members on deck with poles and/or ropes to try and guide the CTD back onto the deck. With the ship rocking and rolling out to sea, this can be a tad dangerous, especially when much of this work is done close to the waterline with waves splashing on deck.

The RV Hugh R Sharp has a CTD handling system that is pretty much designed to be operated by one marine technician, one of two currently in use in the UNOLS fleet (the other is on the RV Kilo Moana).

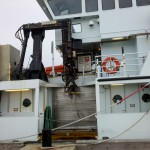
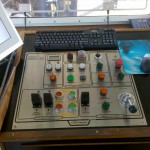
The marine technician on the Sharp is up on the bridge level and looks down through windows at the wet lab area and beside the ship. This allows them to control the deployment and the recovery of the CTD from a much safer location. The Caley CTD Handling System has motion compensation built in to cancel out the roll and pitch of the ship and is designed to mostly eliminate the swaying of the CTD system.  This makes for a much smoother and safer CTD deployment and recovery, which can occur quite often on many research vessels. The following pictures show the control station up on the bridge and an exterior view of the Caley CTD Handling System onboard the Sharp.

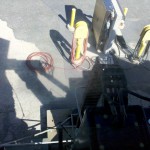
Caley Ocean Systems CTD Handling System - RV Hugh R SharpCTD Handling System Control Station - RV Hugh R SharpView From The Control Station

Next time I’m out on the Sharp, I’ll try to get a view of the system in action from outside the wet lab.

Is the system perfect? No, they still have some kinks to work out and with Caley located over in the UK, turn-around time can be pretty slow at times. The vessel operators are taking some lumps and trying to iron the kinks out of a system that can help make it a little safer to do routine underway CTD casts. Their efforts should be applauded.

My IT is Greener than Your IT (or Server Virtualization FTW)

Carbon Carbon Everywhere

Carbon footprint, carbon emissions, carbon taxes…carbon carbon carbon. That’s all we’re hearing these days. If we do something that implies that we’re using less carbon then voila! We’re suddenly “Going Green”. As a carbon-based life form, I’m quite fond of carbon personally, but the story today is about how to minimize the amount of carbon that we’re responsible for having spewed into the atmosphere and taken up by the oceans. So the thing you need to do to eliminate your carbon footprint as well as the footprint of your neighbors and their neighbors is install a 2 Megawatt Wind Turbine. Problem solved…you are absolved of your carbon sins and you may go in peace.
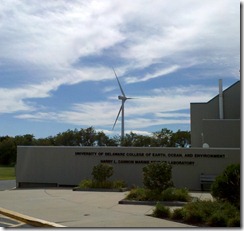
Lewes_Turbine

What’s that you say? You don’t have a 2MW wind turbine in this years budget? Then it’s on to Plan B…well Plan A in my case as I started down this road years ago. Long before we installed the turbine. Even though the end result is a much greener IT infrastructure, that plan was originally geared towards gaining more system flexibility, efficiency and capabilities in our server infrastructure.  I’d be lying if I said I started out doing it to “be green”, even though that was an outcome from the transition. (Unless of course I’m filling out a performance appraisal and it’ll give me some bonus points for saying so – in which case I ABSOLUTELY had that as my primary motivator ;?)

One of the things that we do here in the Ocean Information Center is to prototype new information systems. We specialize in creating systems that describe, monitor, catalog and provide pointers to global research projects as well as their data and data products. We research various information technologies and try to build useful systems out of them. In the event that we run into a show stopper with that technology, we sometimes have to revert to another technology that is incompatible with those in use on the server. Whether they be the operating system, the programming language, the framework or the database technologies selected. In these scenarios, it is hugely important to compartmentalize and separate the various systems that you’re using. We can’t have technology decisions for project A causing grief for project B now can we?

One way to separate the information technologies that you’re using is to install them on different servers. That way you can select a server operating system and affiliated development technologies that play well together and that fit all of the requirements of the project as well as its future operators. With a cadre of servers at your disposal, you can experiment to your hearts content without impacting the other projects that you’re working with.  So a great idea is to buy one or more servers that are dedicated to each project…which would be wonderful except servers are EXPENSIVE. The hardware itself is expensive, typically costing thousands of dollars for each server. The space that is set aside to house the servers is expensive – buildings and floor space ain’t cheap. The air conditioners that are needed to keep them from overheating is expensive (my rule of thumb is that if you can stand the temperature of the room, then the computers can). And lastly the power to run each server is expensive – both in direct costs to the business for electricity used and in the “carbon costs” that generating said electricity introduce. I was literally run out of my last lab by the heat that was being put out by the various servers. It was always in excess of 90 F in the lab, especially in the winter when there was no air conditioners running. So my only option was to set up shop in a teeny tiny room next to the lab. Something had to give.

We Don’t Need No Stinkin’ Servers (well, maybe a few)

A few years ago I did some research on various server virtualization technologies and, since we were running mostly Windows-based servers at the time, I started using Microsoft’s Virtual Server 2005. Pretty much the only other competitor at the time was VMWare’s offerings. I won’t bore you with the sales pitch of “most servers usually only tap 20% or so of the CPU cycles on the system” in all its statistical variations, but the ability to create multiple “virtual machines” or VMs on one physical server came to the rescue. I was able to create many “virtual servers” for each physical server that I had now. Of course, to do this, you had to spend a tad more for extra memory, hard drive capacity and maybe an extra processor; but the overall cost to host multiple servers for the cost of one physical box (albeit slightly amped up) were much less now. To run Virtual Server 2005, you needed to run Windows Server 2003 64-bit edition so that you could access > 4Gigs of RAM. You wanted a base amount of memory for the physical server’s operating system to use, and you needed some extra RAM to divvy up amongst however many virtual servers you had running on the box. Virtual Server was kind of cool in that you could run multiple virtual servers, each in their own Internet Explorer window. While that worked okay, a cool tool came on the scene that helped you manage multiple Virtual Server 2005 “machines” with an easier administrative interface. It was called “Virtual Machine Remote Control Client Plus”. Virtual Server 2005 served our needs just fine, but eventually a new Windows Server product line hit the streets and Windows Server 2008 was released to manufacturing (RTM) and shipping on the new servers.

Enter Hyper-V

A few months after Windows Server 2008 came out, a new server virtualization technology was introduced called “Hyper-V”. I say a “few months after” because only a Beta version of Hyper-V was included in the box when Windows Server 2008 rolled off the assembly line. A few months after it RTM’d though, you could download an installer that would plug in the RTM version of it. Hyper-V was a “Role” that you could easily add to a base Win2k8 Server install that allowed you to install virtual machines on the box. We tinkered around with installing the Hyper-V role on top of a “Server Core” (a stripped-down meat and potatoes version of Win2k8 Server) but we kept running into road blocks in what functionality and control was exposed so we opted to install the role under the “Full Install” of Win2k8. You get a minor performance hit doing so, but nothing that I think I notice. A new and improved version came out recently with Windows Server 2008 R2 that added some other bells and whistles to the mix.

The advantages of going to server virtualization were many. Since I needed fewer servers they were:

  • Less Power Used – fewer physical boxes meant lower power needs
  • Lower Cooling Requirements – fewer boxes generating heat meant lower HVAC load
  • Less Space – Floor space is expensive, fewer servers require fewer racks and thus less space
  • More Flexibility– Virtual Servers are easy to spin up and roll back to previous states via snapshots
  • Better Disaster Recovery – VMs can be easily transported offsite and brought online in case of a disaster
  • Legacy Projects Can Stay Alive – Older servers can be decommissioned and legacy servers moved to virtual servers

Most of these advantages are self-evident. I’d like to touch on a little more are the “flexibility”, “disaster recovery” and “Legacy Projects” topics which are very near and dear to my heart.

Flexibility

The first, flexibility, was a much needed feature. I can’t count how many times we’d be prototyping a new feature and then, when we ran into a show-stopper, would have to reset and restore the server from backup tapes. So the sequence would be back up the server, make your changes and then, if they worked, we’d move on to the next state. If they didn’t we might have to restore from backup tapes.  All of these are time-consuming and, if you run into a problem with the tape (mechanical systems are definitely failure prone), you were up the creek sans paddle. A cool feature of all modern virtualization technologies is the ability to create a “snapshot” of your virtual machine’s hard drives and cause any future changes to happen to a different linked virtual hard disk. In the event that something bad happens with the system, you simply revert back to the pre-snapshot version (there can be many) and you’re back in business. This means that there is much less risk in making changes (as long as you remember to do a snapshot just prior) – and the snapshotting process takes seconds versus the minutes to hours that a full backup would take on a non-virtualized system.

Another cool feature of snapshots is that they can be leveraged on research vessels. The thought is that you get a virtual machine just the way you want it (whether it’s a server or a workstation). Before you head out on a cruise you take a snapshot of the virtualized machine and let the crew and science parties have their way with it while they’re out. When the ship returns, you pull the data off the virtualized machines and then revert them to their pre-cruise snapshots and you’ve flushed away all of the tweaks that were made on the cruise (as well as any potential malware that was brought onboard) and you’re ready for your next cruise.

Another capability that I’m not able to avail myself of is the use Hyper-V in failover and clustering scenarios.  This is pretty much the ability to have multiple Hyper-V servers in a “cluster” where multiple servers are managed as one unit. Using Live Migration, the administrator (or even the system itself based on preset criteria) can “move” virtual machines from Hyper-V server to Hyper-V server. This would be awesome for those times when you want to bring down a physical server for maintenance or upgrades but you don’t want to have to shut down the virtual servers that it hosts. Using clustering, the virtual servers on a particular box can be shuttled over to other servers, which eliminates the impact of taking down a particular box. One of the requirements to do this is a back-end SAN (storage area network) that hosts all of the virtual hard drive files, which is way beyond my current budget. (Note: If you’d like to donate money to buy me one, I’m all for it ;?)

I also use virtualization technologies on the workstation side. Microsoft has their Virtual PC software that you can use to virtualize say an XP workstation OS on your desktop or laptop for testing and development. Or maybe you want to test your app against a 32-bit OS but your desktop or laptop is running a 64-bit OS? No worries, virtualization to the rescue. The main problem with Virtual PC is that it’s pretty much Windows-only and it doesn’t support 64-bit operating systems, so trying to virtualize a Windows 2008 R2 instance to kick the tires on it is a non-starter. Enter Sun’s…errr…Oracle’s Virtual Box to the rescue. It not only supports 32 and 64-bit guests, but it also supports Windows XP, Vista and 7 as well as multiple incarnations of Linux, DOS and even Mac OS-X (server only).

What does “support” mean? Usually it means that the host machine has special drivers that can be installed on the client computer to get the best performance under the virtualization platform of choice. These “Guest Additions” usually improve performance but they also handle things like seamless mouse and graphics integration between the host operating system and the guest virtual machine screens. Guest operating systems that are not “supported” typically end up using virtualized legacy hardware, which tends to slow down their performance. So if you want to kick the tires on a particular operating system but don’t want to pave your laptop or desktop to do so, virtualization is the way to go in many cases.

The use cases are endless, so I’ll stop there and let you think of other useful scenarios for this feature.

Disaster Recovery

Disasters are not restricted to natural catastrophes. A disaster is certainly a fire, earthquake, tornado, hurricane, etc. but it can also be as simple as a power spike that fries your physical server or a multi-hard drive failure that takes the server down. In the bad-old-days (pre VM) if your server fried, you hoped that you could find the same hardware as what was installed on the original system so that you could just restore from a backup tape and not be hassled by new hardware and its respective drivers. If you were unlucky enough to not get an exact hardware match, you could end up spending many hours or days performing surgery on the hardware drivers and registry to get things back in working order. The cool thing about virtualized hardware is that the virtual network cards, video cards, device drivers, etc. that are presented to the virtual machine running on the box were pretty much the same across the board. This means that if one of my servers goes belly up, or if I want to move my virtual machine over to another computer for any reason, there will be few if any tweaks necessary to get the VM up and running on the new physical box.

Another bonus to this out-of-the-box virtual hardware compatibility is that I can export my virtual machine and its settings to a folder, zip it up and ship it pretty much anywhere to get it back up and online. I use this feature as part of my disaster recovery plan. On a routine basis (monthly at least) I shut down the virtual machine, export the virtual machine settings and its virtual hard drives, and then zip them up and send them offsite. This way if disaster does strike, I have an offsite backup that I can bring online pretty quickly. This also means that I can prototype a virtual server for a given research project and, when my work is complete, hand off the exported VM to the host institutions IT department to spin up under their virtualized infrastructure.

Legacy Projects

I list this as a feature, but others may see this as a curse. There are always those pesky “Projects That Won’t Die”! You or somebody else set them up years ago and they are still deemed valuable and worthy of continuation. Either that or nobody wants to make the call to kill the old server – it could be part of a complex mechanism that’s computing the answer to life, the universe and everything. Shutting it down could cause unknown repercussions in the space-time continuum. The problem is that many hardware warranties only run about 3 years or so. With Moore’s Law in place, even if the physical servers themselves won’t die – they’re probably running at a crawl compared to all of their more recent counterparts. More importantly, the funding for those projects ran out YEARS ago and there just isn’t any money available to purchase new hardware or even parts to keep it going. My experience has been that those old projects, invaluable as they are, require very little CPU power or memory. Moving them over to a virtual server environment will allow you to recycle the old hardware, save power, and help reduce the support time that was needed for “old faithful”.

An easy (and free) way to wiggle away from the physical and into the virtual is via the SysInternals Disk2VHD program. Run it on the old box and in most cases it will crank out files and virtual hard disks (VHDs) that you can mount in your virtual server infrastructure relatively painlessly. I’m about to do this on my last two legacy boxes – wish me luck!

Conclusion

Most of my experience has been with Microsoft’s Hyper-V virtualization technology. A good starter list of virtualization solutions to consider is:

Hopefully my rambling hasn’t put you to sleep. This technology has huge potential to help save time and resources, which is why I got started with it originally. Take some time, research the offerings and make something cool with it!

CTD and Dissolved Oxygen Measurement via Winkler Titration

Last fall I was on the RV Hugh R Sharp for a short research cruise out in the Delaware Bay. We were sharing the Sharp with chief scientist Dr. George Luther, who was doing a mooring deployment that contained a dissolved oxygen sensor (among several other sensors). As part of the calibration check to make sure the readings were correct while we were on station, Dr. Luther did several CTD casts to take some water samples at various depths. I snagged the trusty video camera and got him to explain what he was doing and why.

To verify the accuracy of modern electronic oxygen sensors, oceanographers still verify the dissolved oxygen concentration using what’s called the Winkler test for dissolved oxygen. Dr. Luther showed the process of fixing oxygen into a MnOOH solid, which is then measured by the Winkler titration. This allows scientists to compare the oxygen readings they’re getting now with historical records of oxygen levels going back to the late 1800’s (an important thing to do when you’re trying to determine long-term trends by comparing historical records against more recent observations). It also allows them to verify the readings that they’re getting from modern electronic oxygen sensors.

I’ll sneak down to Dr. Luther’s lab soon and video the second part of the process, where they add the additional chemicals to the mix and determine the actual concentration of dissolved oxygen. Thanks again to Dr. Luther for taking time to explain the process.

Clean Energy from the Ocean: The Mid-Atlantic Wind Park

Drew Murphy, Northeast Region President of NRG Energy Inc., presented the August 19, 2010 lecture in the University of Delaware’s Coastal Currents Lecture Series. NRG owns offshore wind energy developer NRG Bluewater Wind. Mr. Murphy’s excellent presentation on the company’s planned “Mid-Atlantic Wind Park” project off the Delaware coast provided guests with a broad perspective on the challenges to as well as the economic, environmental and energy-related benefits from developing an offshore wind park.

His presentation helped answer questions I hear quite often: “How can offshore wind be developed in the US?”, “Why is offshore wind a good source of clean and reliable energy?” and “How are they able to install wind turbines so far out in the water?”.

Before this talk, I had no clue about some of specialized vessels and equipment used in the offshore wind projects.  Thanks to Mr. Murphy I now have some insights on how it might be accomplished, and why it would be good for Delaware and for the entire country.

I appreciate NRG’s permission to post this interesting presentation online. You can find out more about the company’s offshore wind and other clean and renewable energy development efforts by visiting http://www.nrgenergy.com.

© 2025 Ocean Bytes Blog

Theme by Anders NorenUp ↑