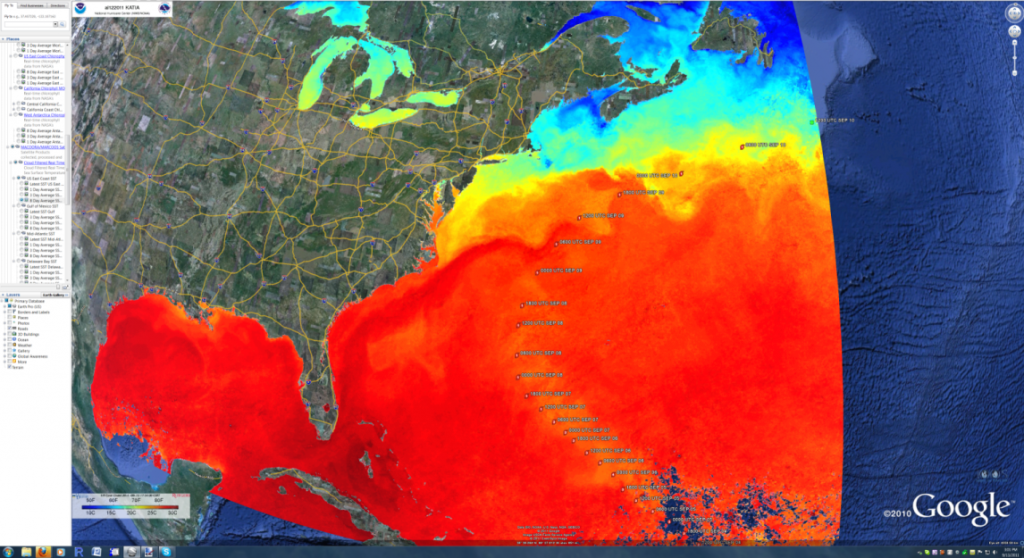
The ORB Lab was having a meeting in the GVis Lab this week and, as usual, the East Coast US 8-Day Averaged Sea Surface Temperature overlay was up on the screens. Dr. Oliver pointed to the screen and noted that there was a path cutting across the Gulf Stream that was cooler than usual and that it was probably due to upwelling and mixing from hurricane Katia. Sure enough, we loaded up a layer showing Katia’s track and they lined up.
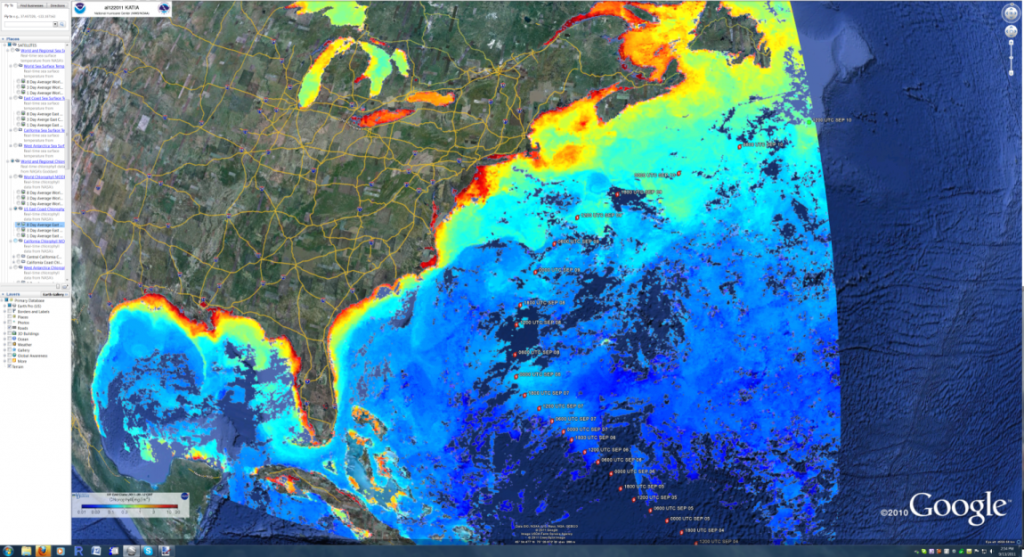
We then checked to see if there was anything noticeable on the East Coast US 8-Day Average Chlorophyll layer and you can see what appears to be a slight bloom in chlorophyll along the track as well (slightly lighter blue).
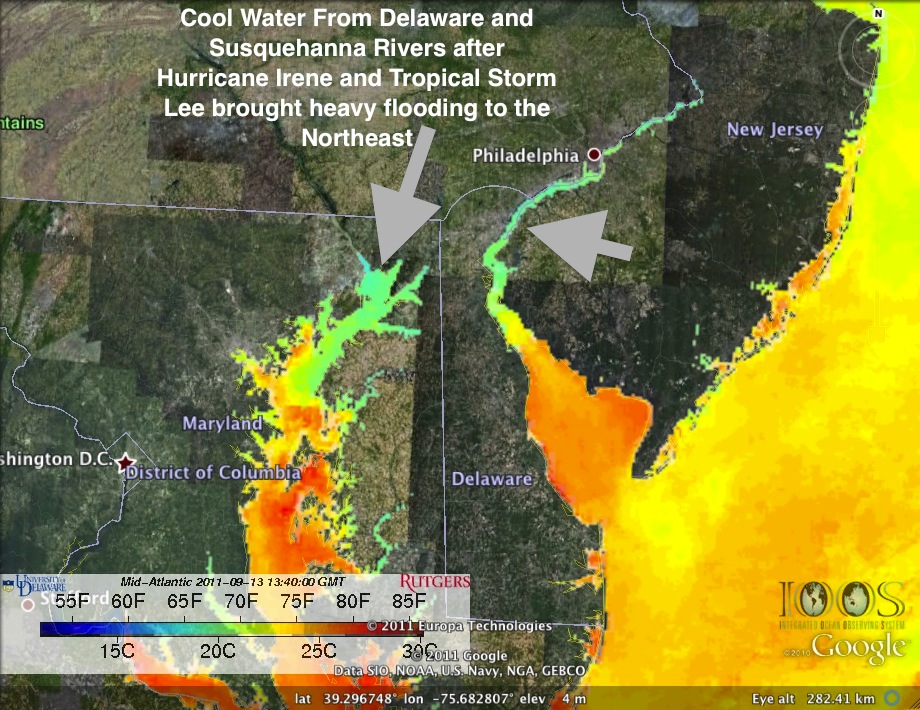
Another neat view is the markedly cooler water that you flowing into the bays from the increased river discharge that resulted from the large amounts of rain dropped by hurricane Katia and tropical storm Lee as they passed through.
These layers and several others are processed and uploaded daily and made available via the Orb Lab website in the Public Access section. They are exposed via Google Maps interfaces as well as Google Earth embedded views and linkable KMZ file formats. Neat stuff!


